
Skip to main content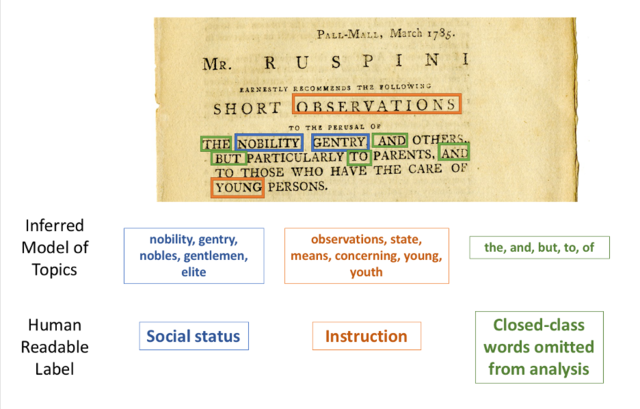


Data Visualizations
Resource slideshow
interactive
loadingloading
loadingloading
loadingloading
loadingloading
loadingloading
loadingloading
Resources
26 resources. Showing results 1 through 20.
Uploaded 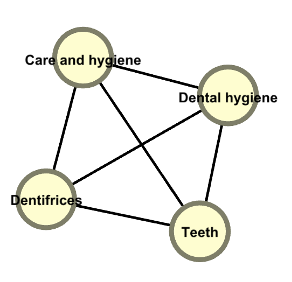
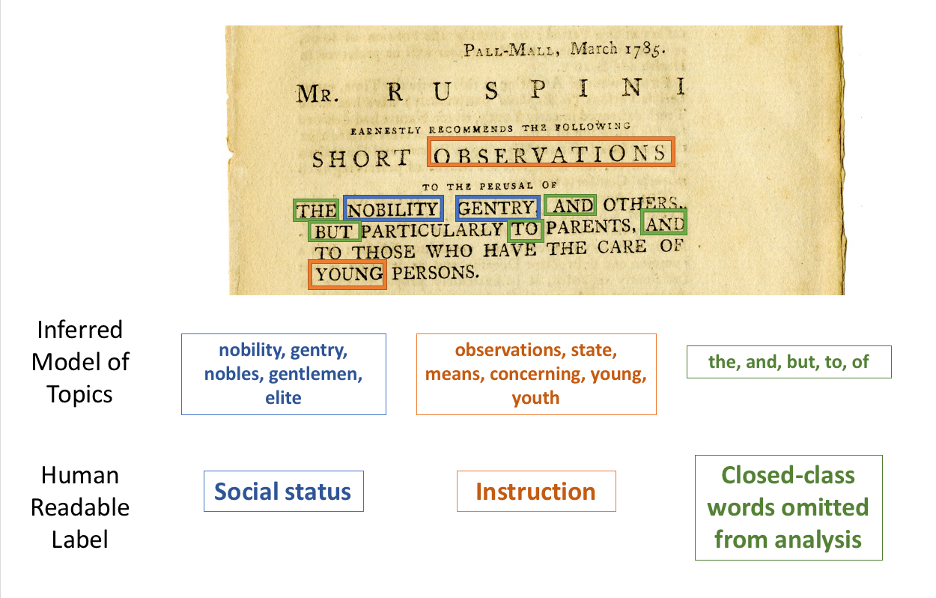
Ruspini Subject Network
Topic Modeling K/cosmopolit in Enlightenment Journals (Interactive)
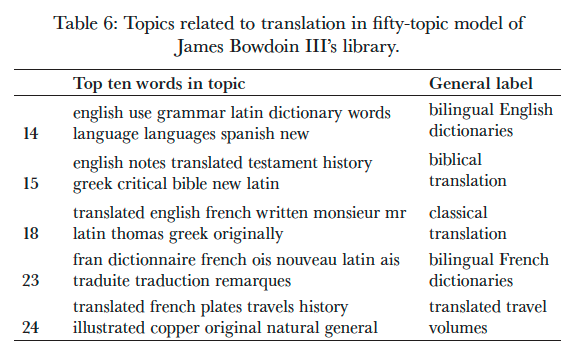
Topics related to translation in fifty-Topic Model of James Bowdoin III’s Library
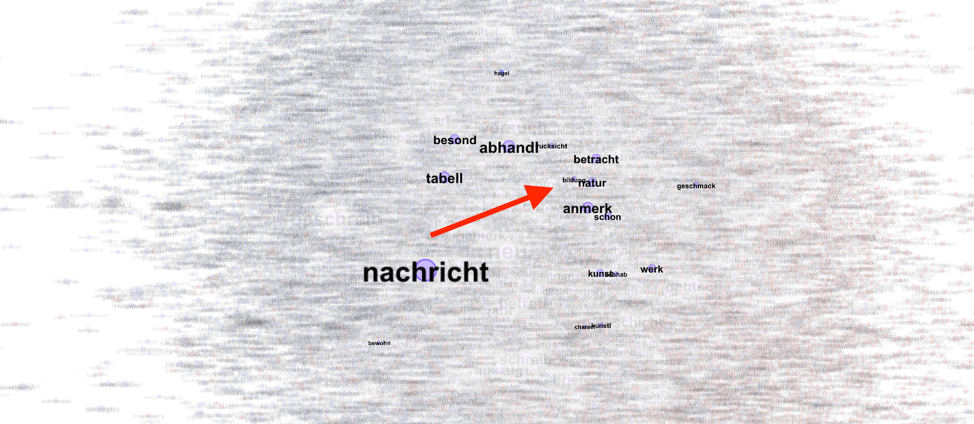
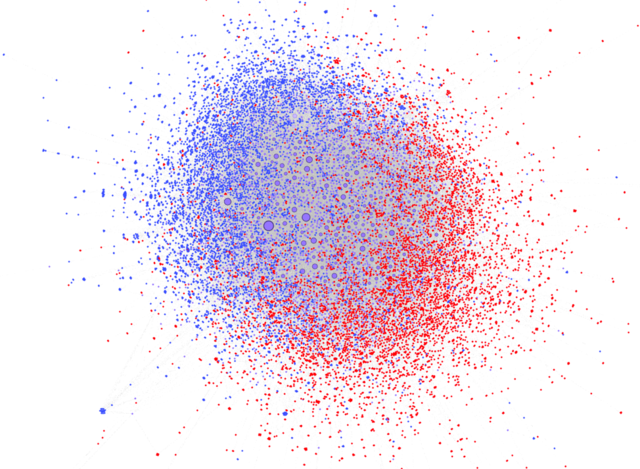
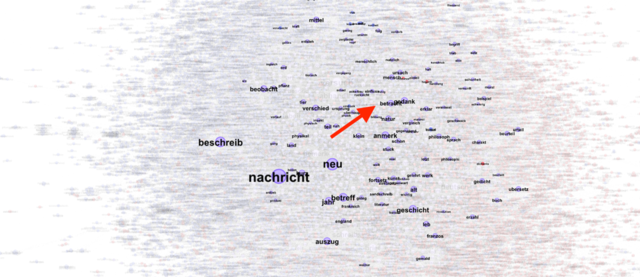
Network diagram of non-stop word terms used in article titles in the database Journals of the German Enlightenment, 1750-1815: Bildung
Index of People, Places and Things in the Volume
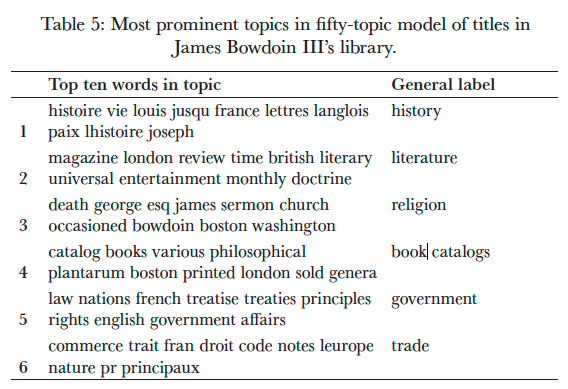
Most prominent topics in fifty-topic model of titles in James Bowdoin III’s library
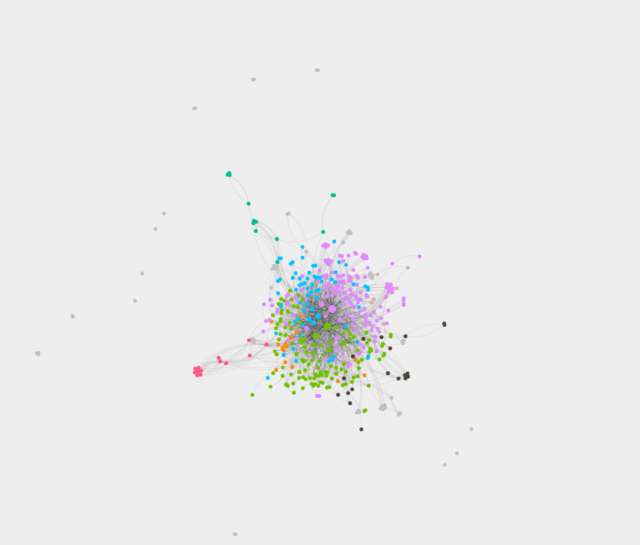
Conversation Networks in Beethoven's Konversationshefte Vol. 11 (Interactive)
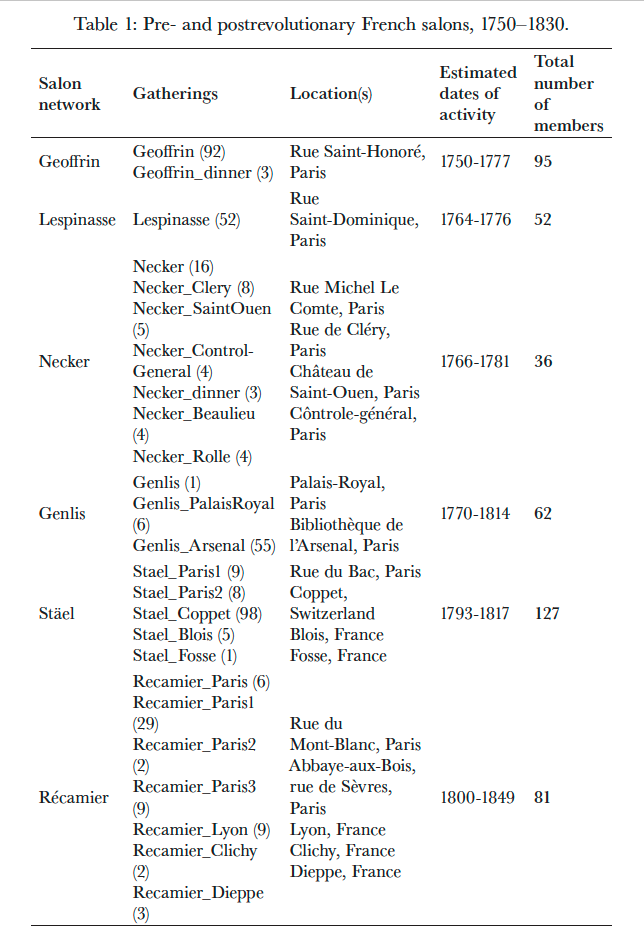
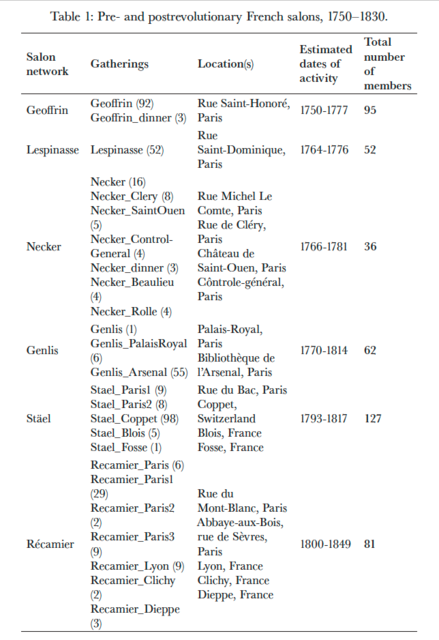
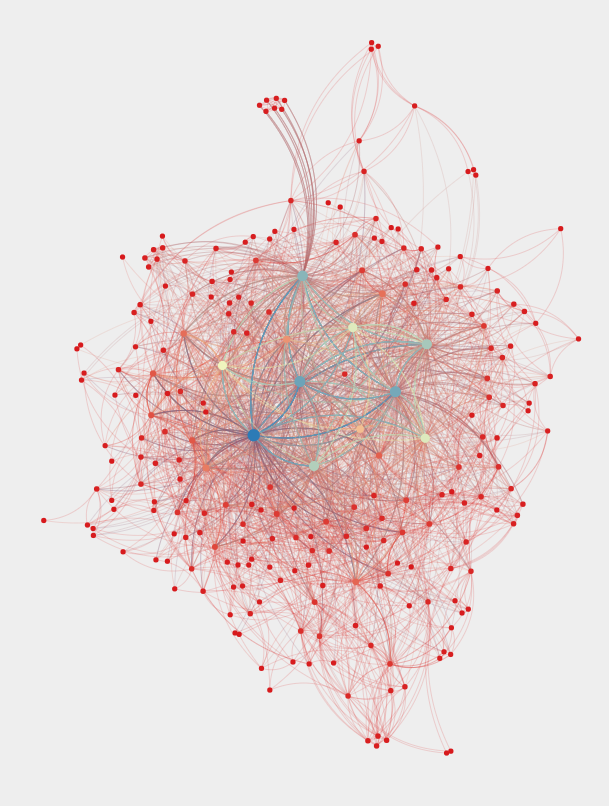
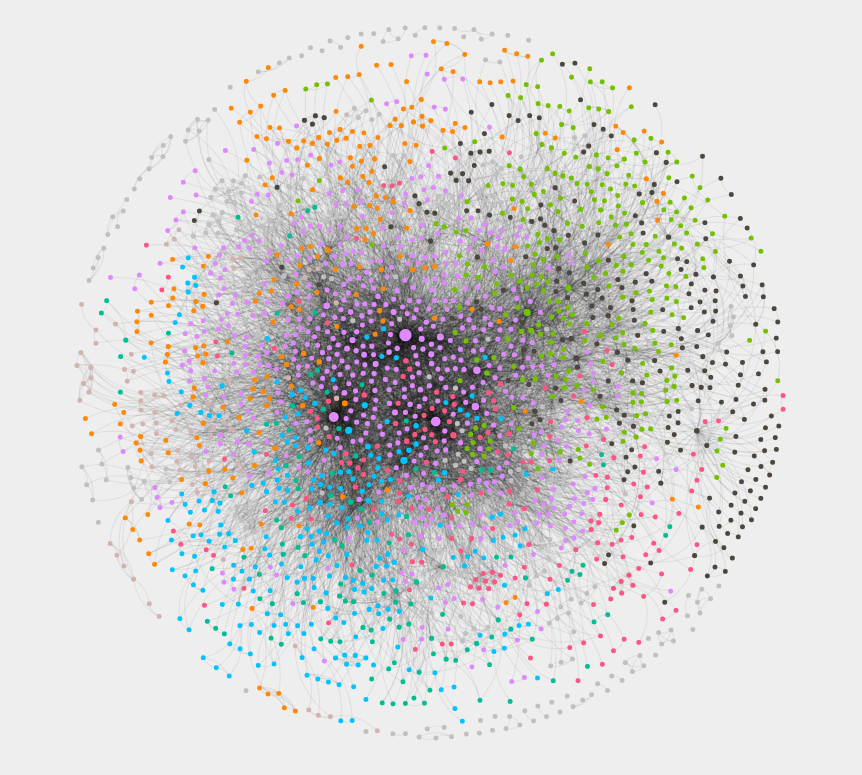
Pre- and post-Revolutionary French salons, 1750-1830
Network visualization of connections in Volume 11 of the critical edition of Beethoven's conversation notebooks.
Conversation Networks in Beethoven's Konversationshefte Vol. 1 (Interactive)
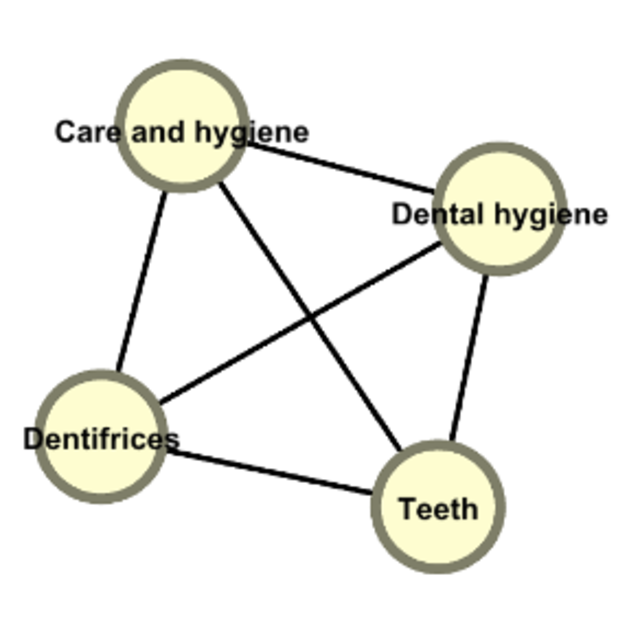
Network visualization of Library of Congress subject headings in James Bowdoin III's library collection

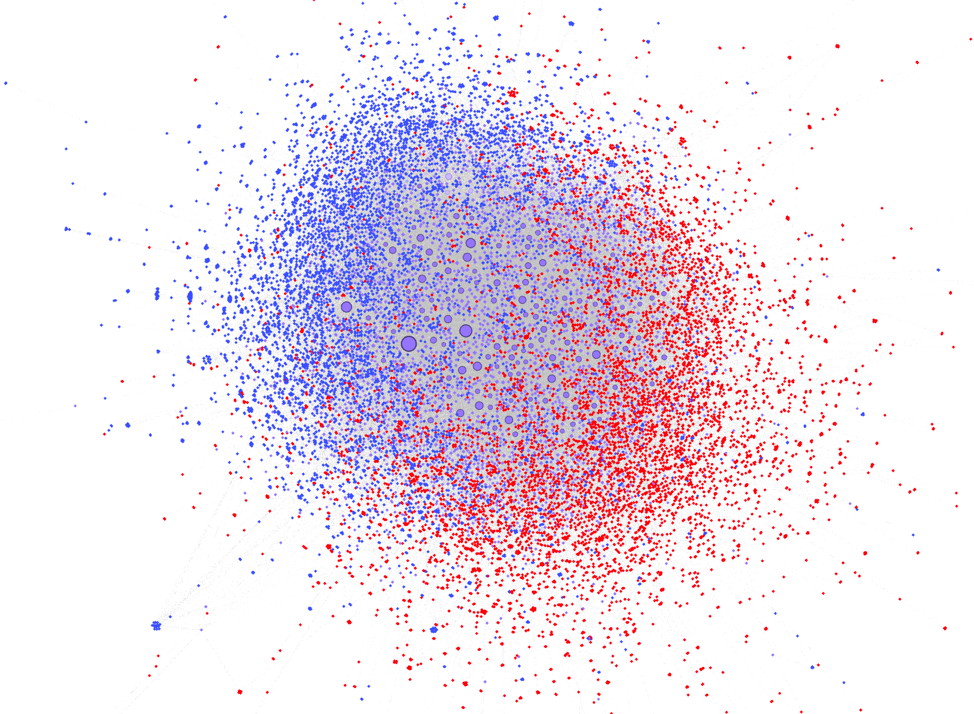
Network diagram of non-stop word terms used in article titles in the database Journals of the German Enlightenment, 1750-1815: Common Terms
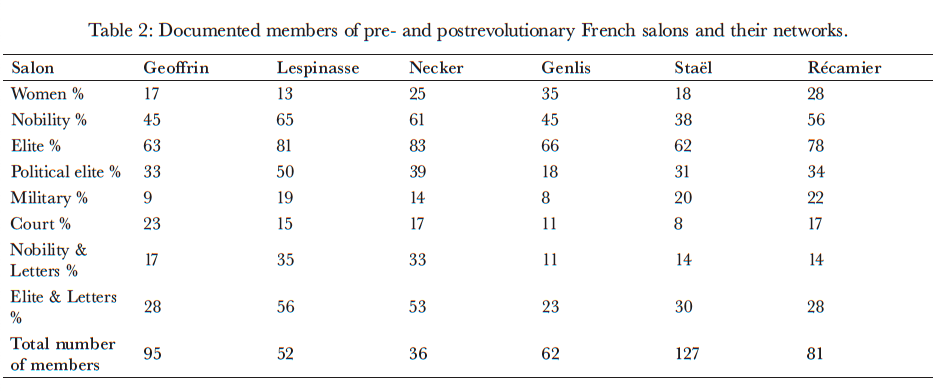
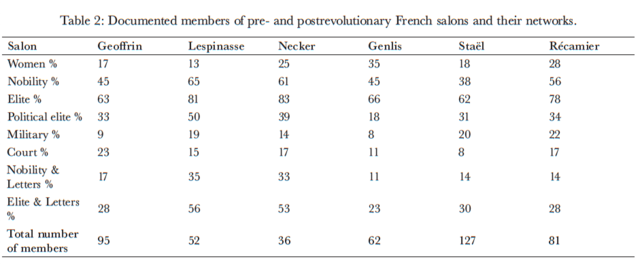
Documented members of pre- and post-Revolutionary French salons and their networks
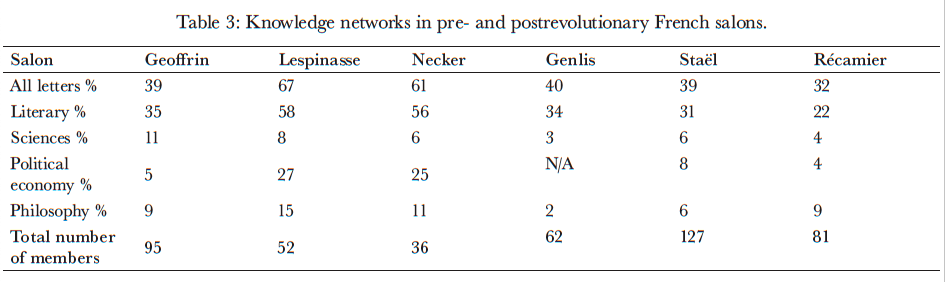
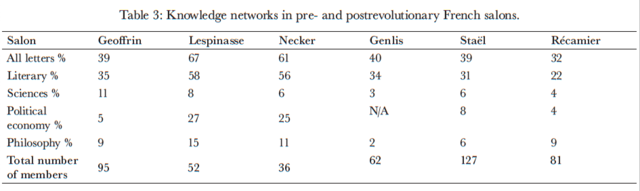
Knowledge networks in pre- and post-Revolutionary French salons
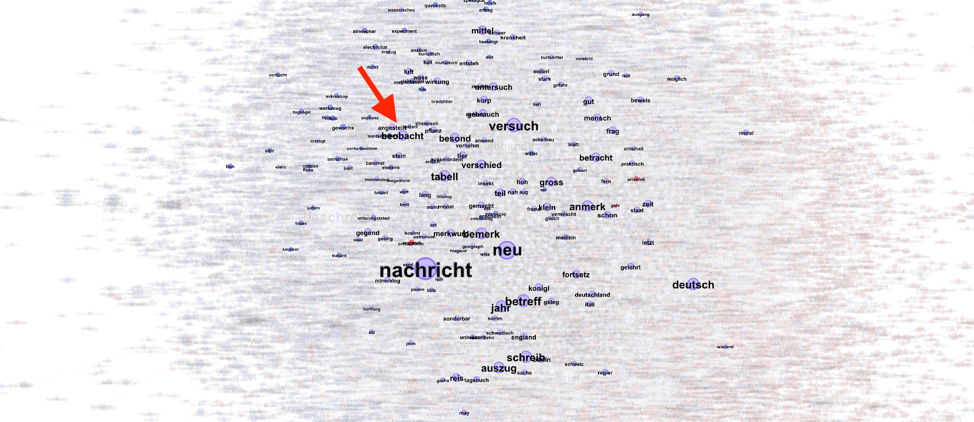
Network diagram of non-stop word terms used in article titles in the database Journals of the German Enlightenment, 1750-1815: Beobacht
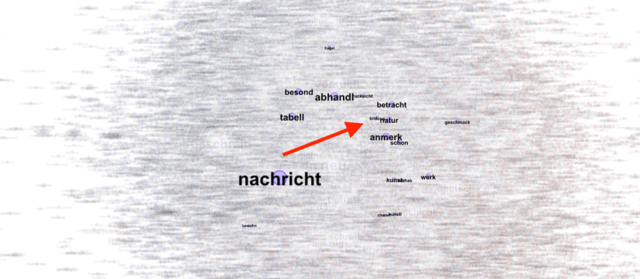
Network diagram of non-stop word terms used in article titles in the database Journals of the German Enlightenment, 1750-1815.

Network diagram of non-stop word terms used in article titles in the database Journals of the German Enlightenment, 1750-1815: Betracht

Network visualization of connections in Volume 1 of the critical edition of Beethoven's conversation notebooks.
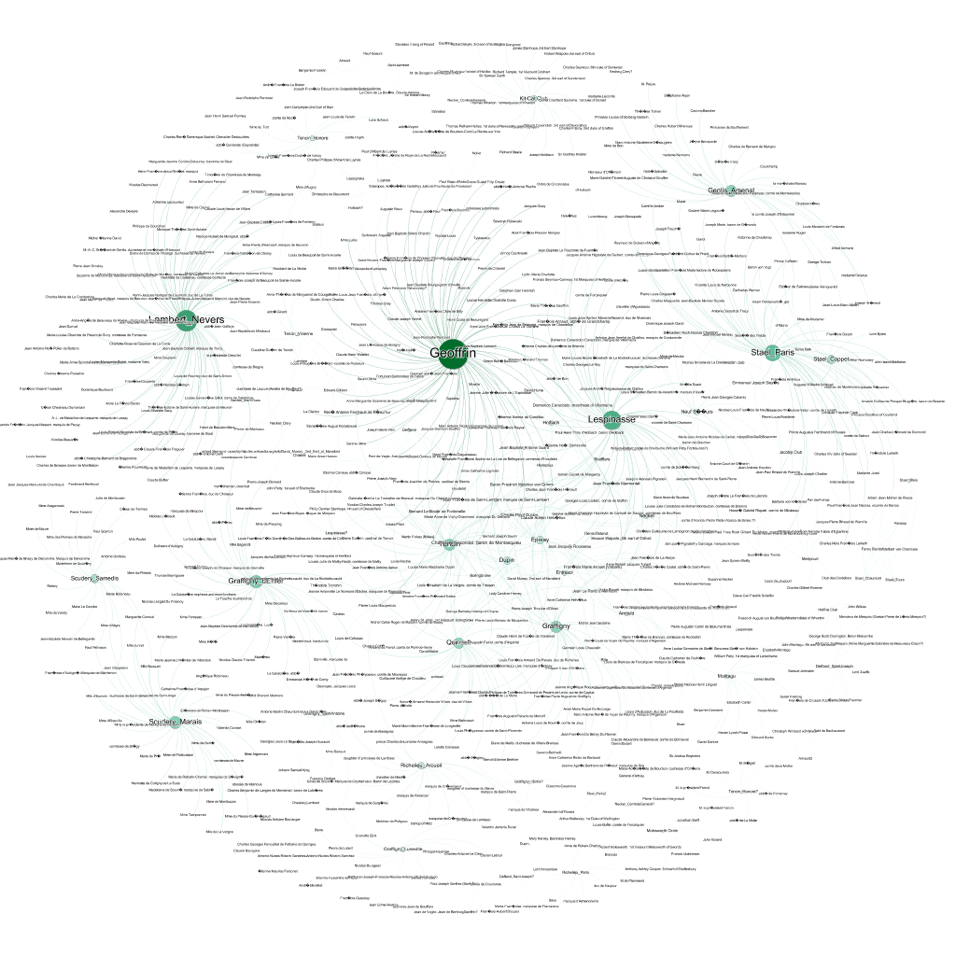
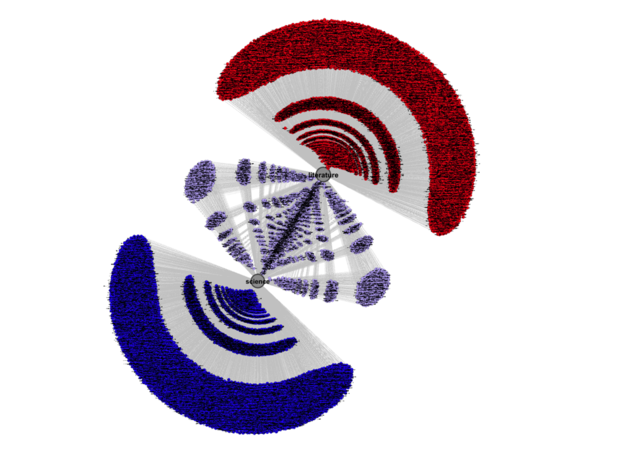
Network diagram of French salon attendance, 1700-1830
Annotations
No one has annotated a text with this resource collection yet.