Skip to main content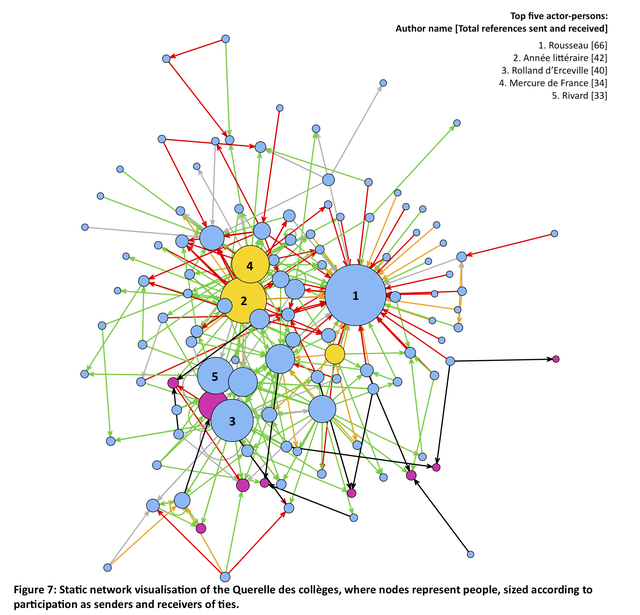

Figures 3: Network Visualisations
Static and dynamic network visualisations to accompany the book, and an introductory video to the dynamic network visualisations
Resource slideshow
interactive
interactive
Resources
5 resources. Showing results 1 through 5.
Uploaded Figure 3. The Querelle as a Dynamic Network of Texts
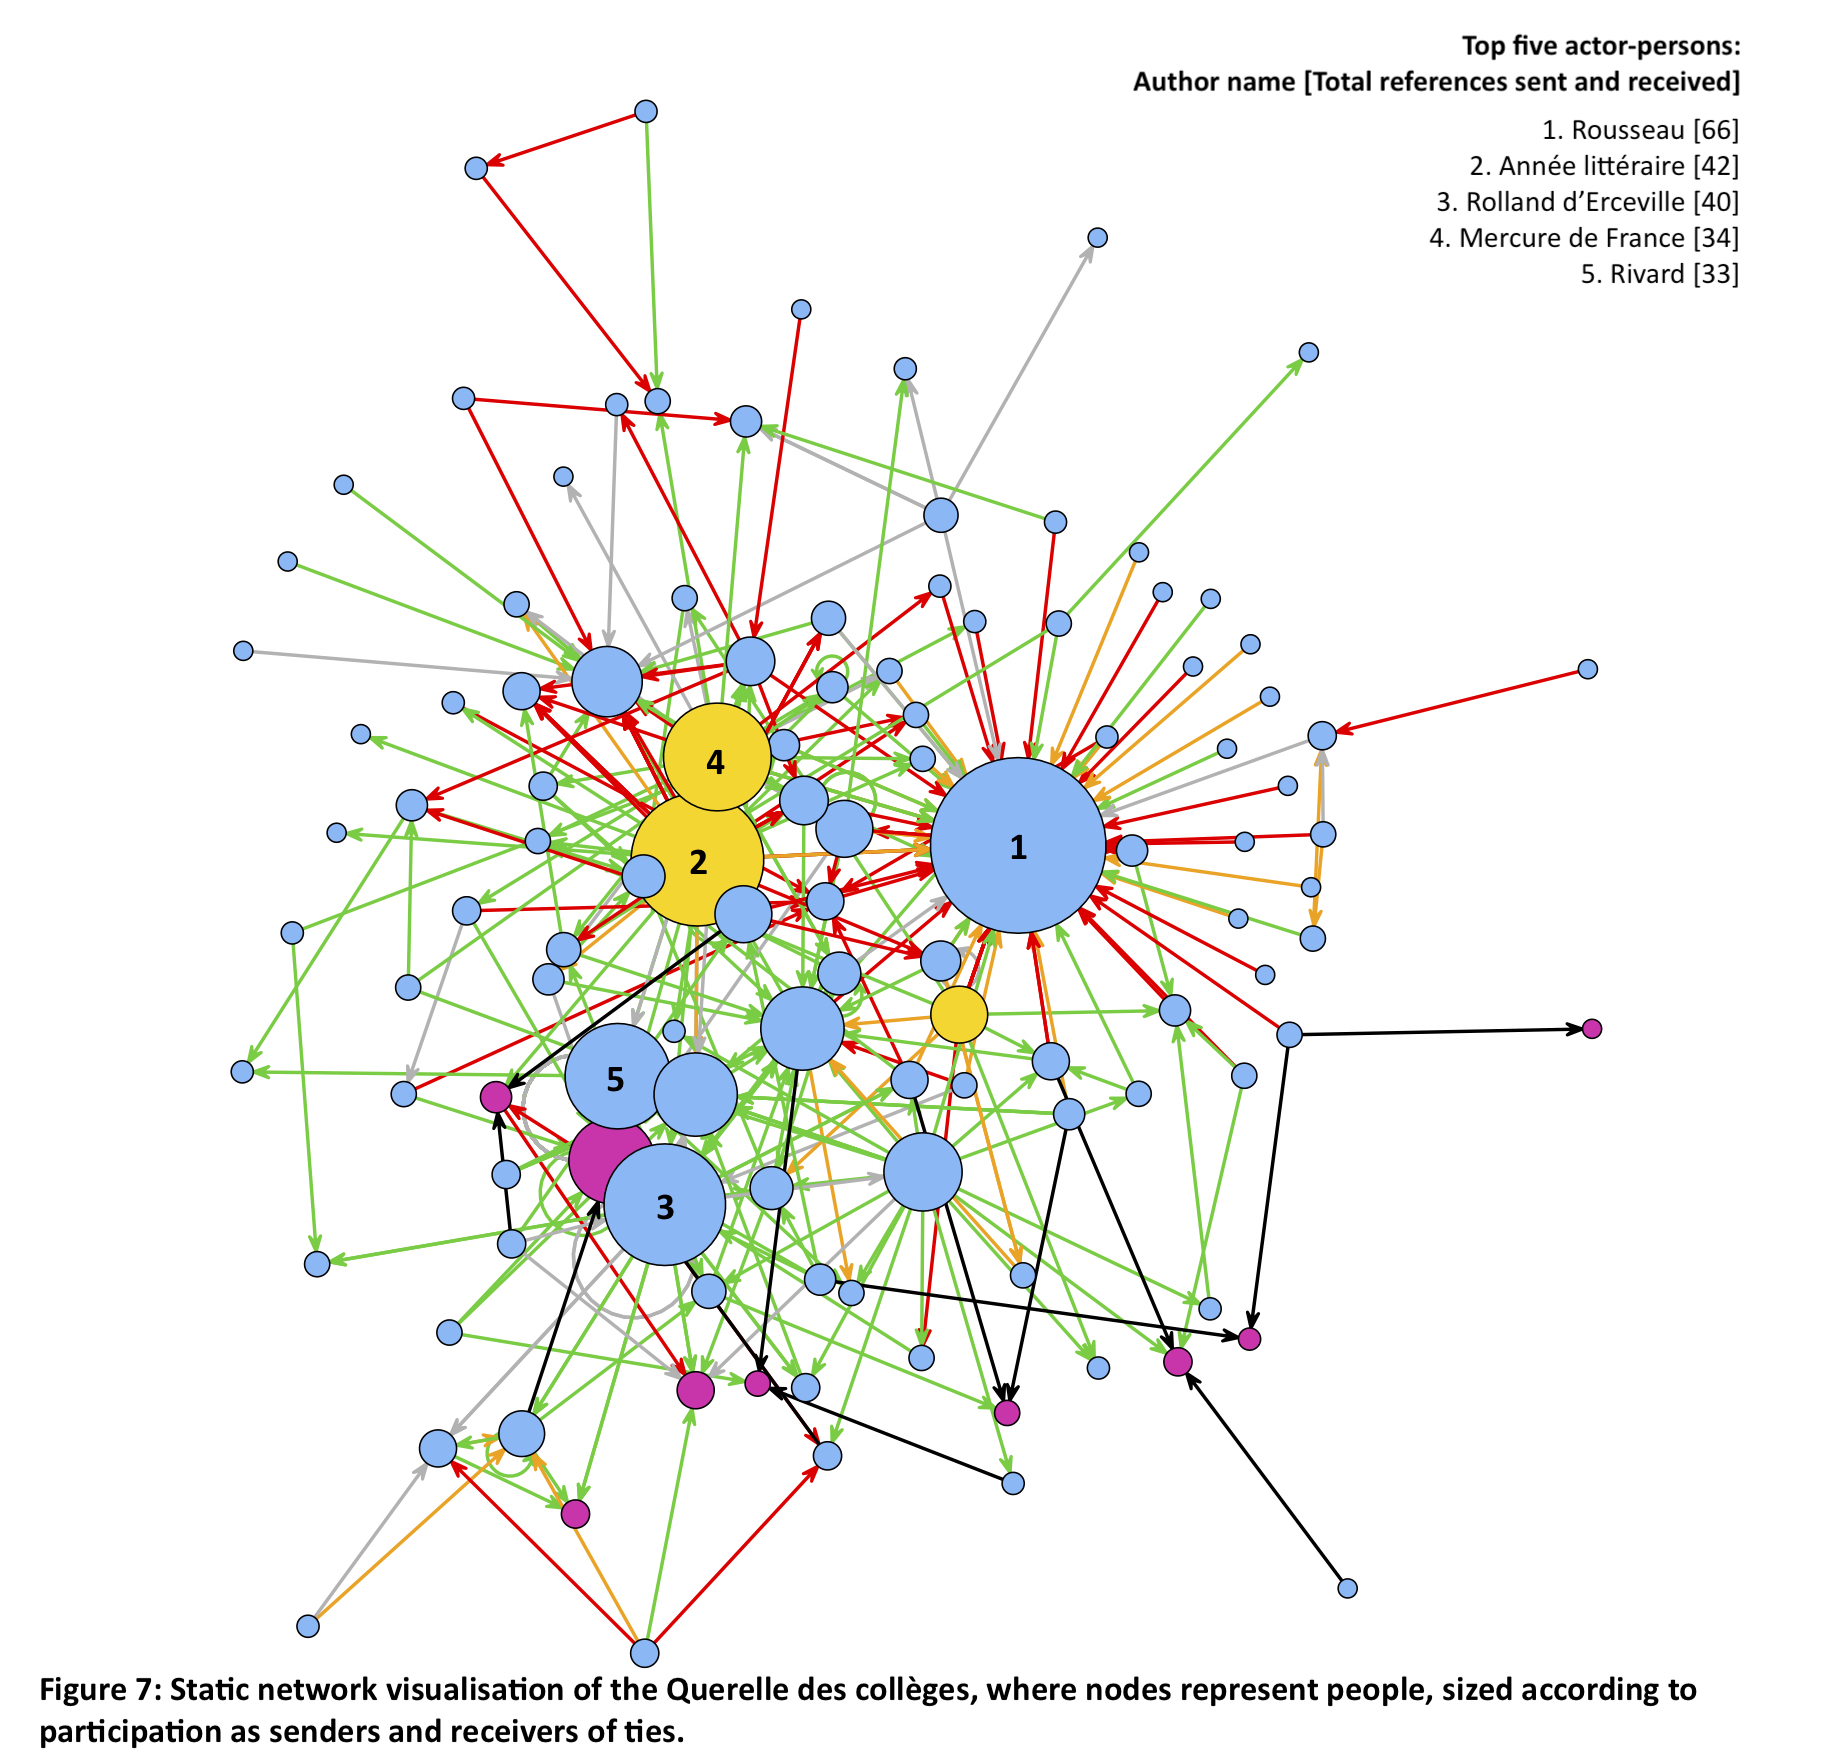
Figure 7: Static network visualisation of the Querelle des collèges, where nodes represent people, and where node size is a function of ties sent and received.
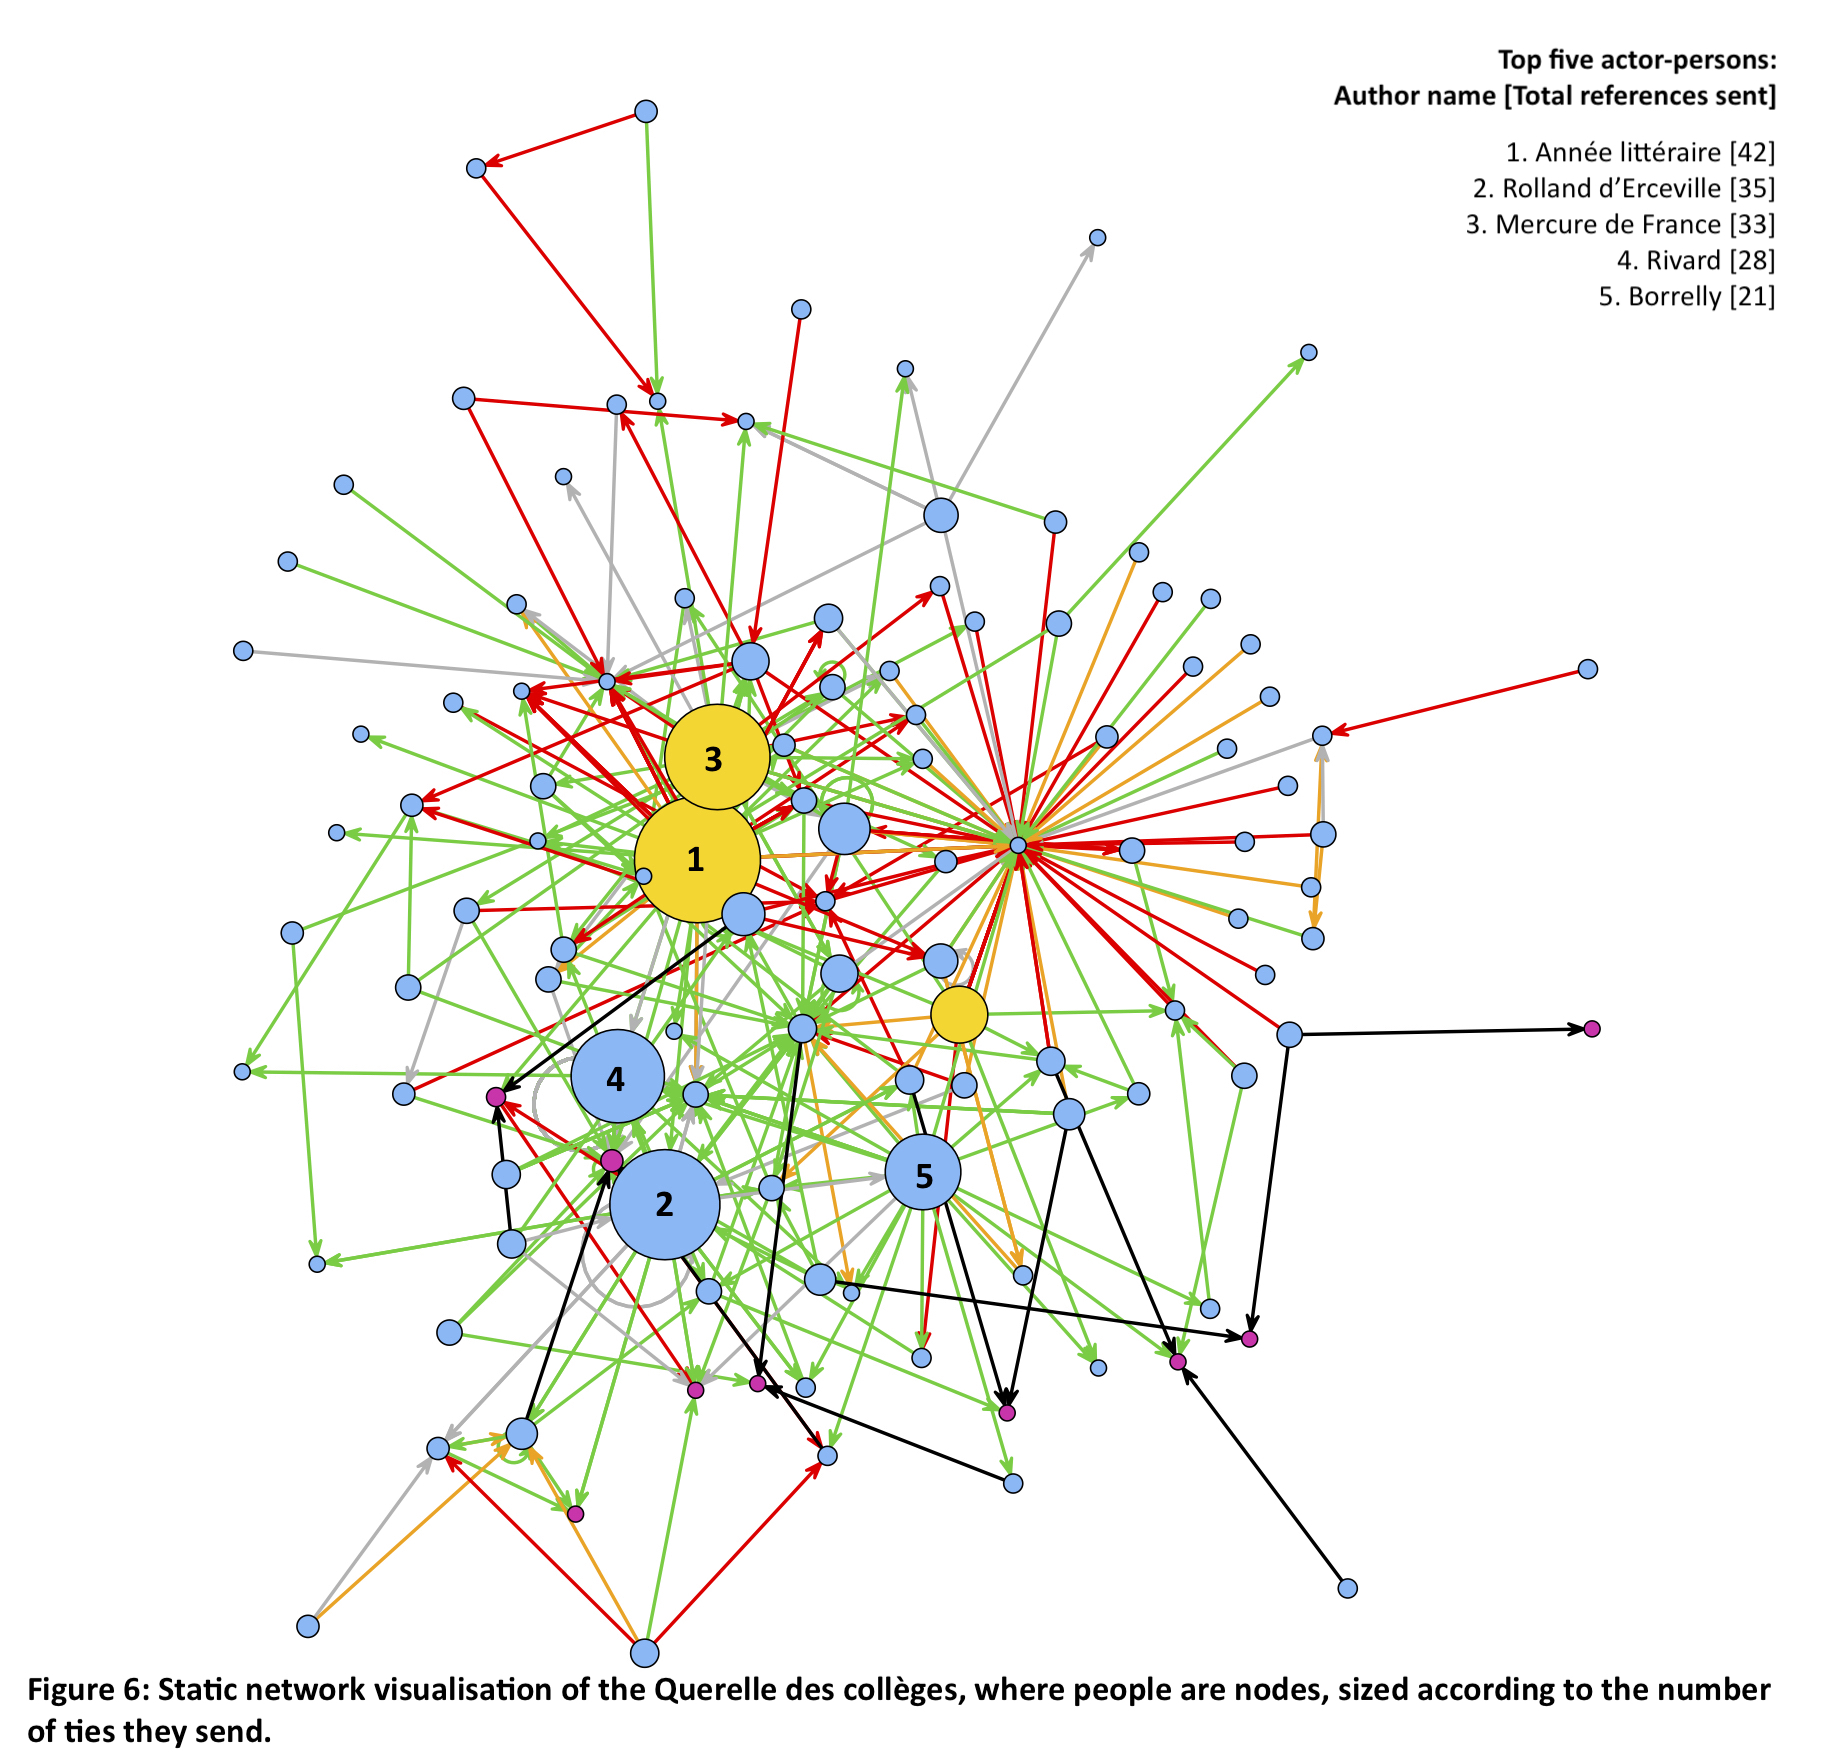
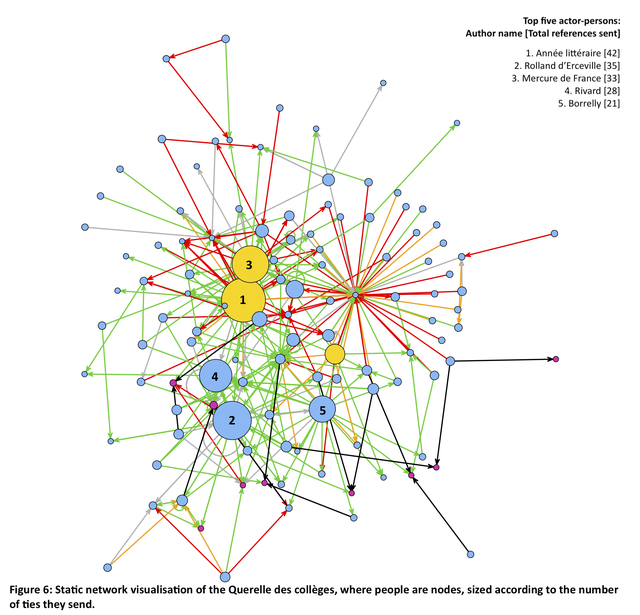
Figure 6: Static network visualisation of the Querelle des collèges, where nodes represent people, and where node size is a function of ties sent.
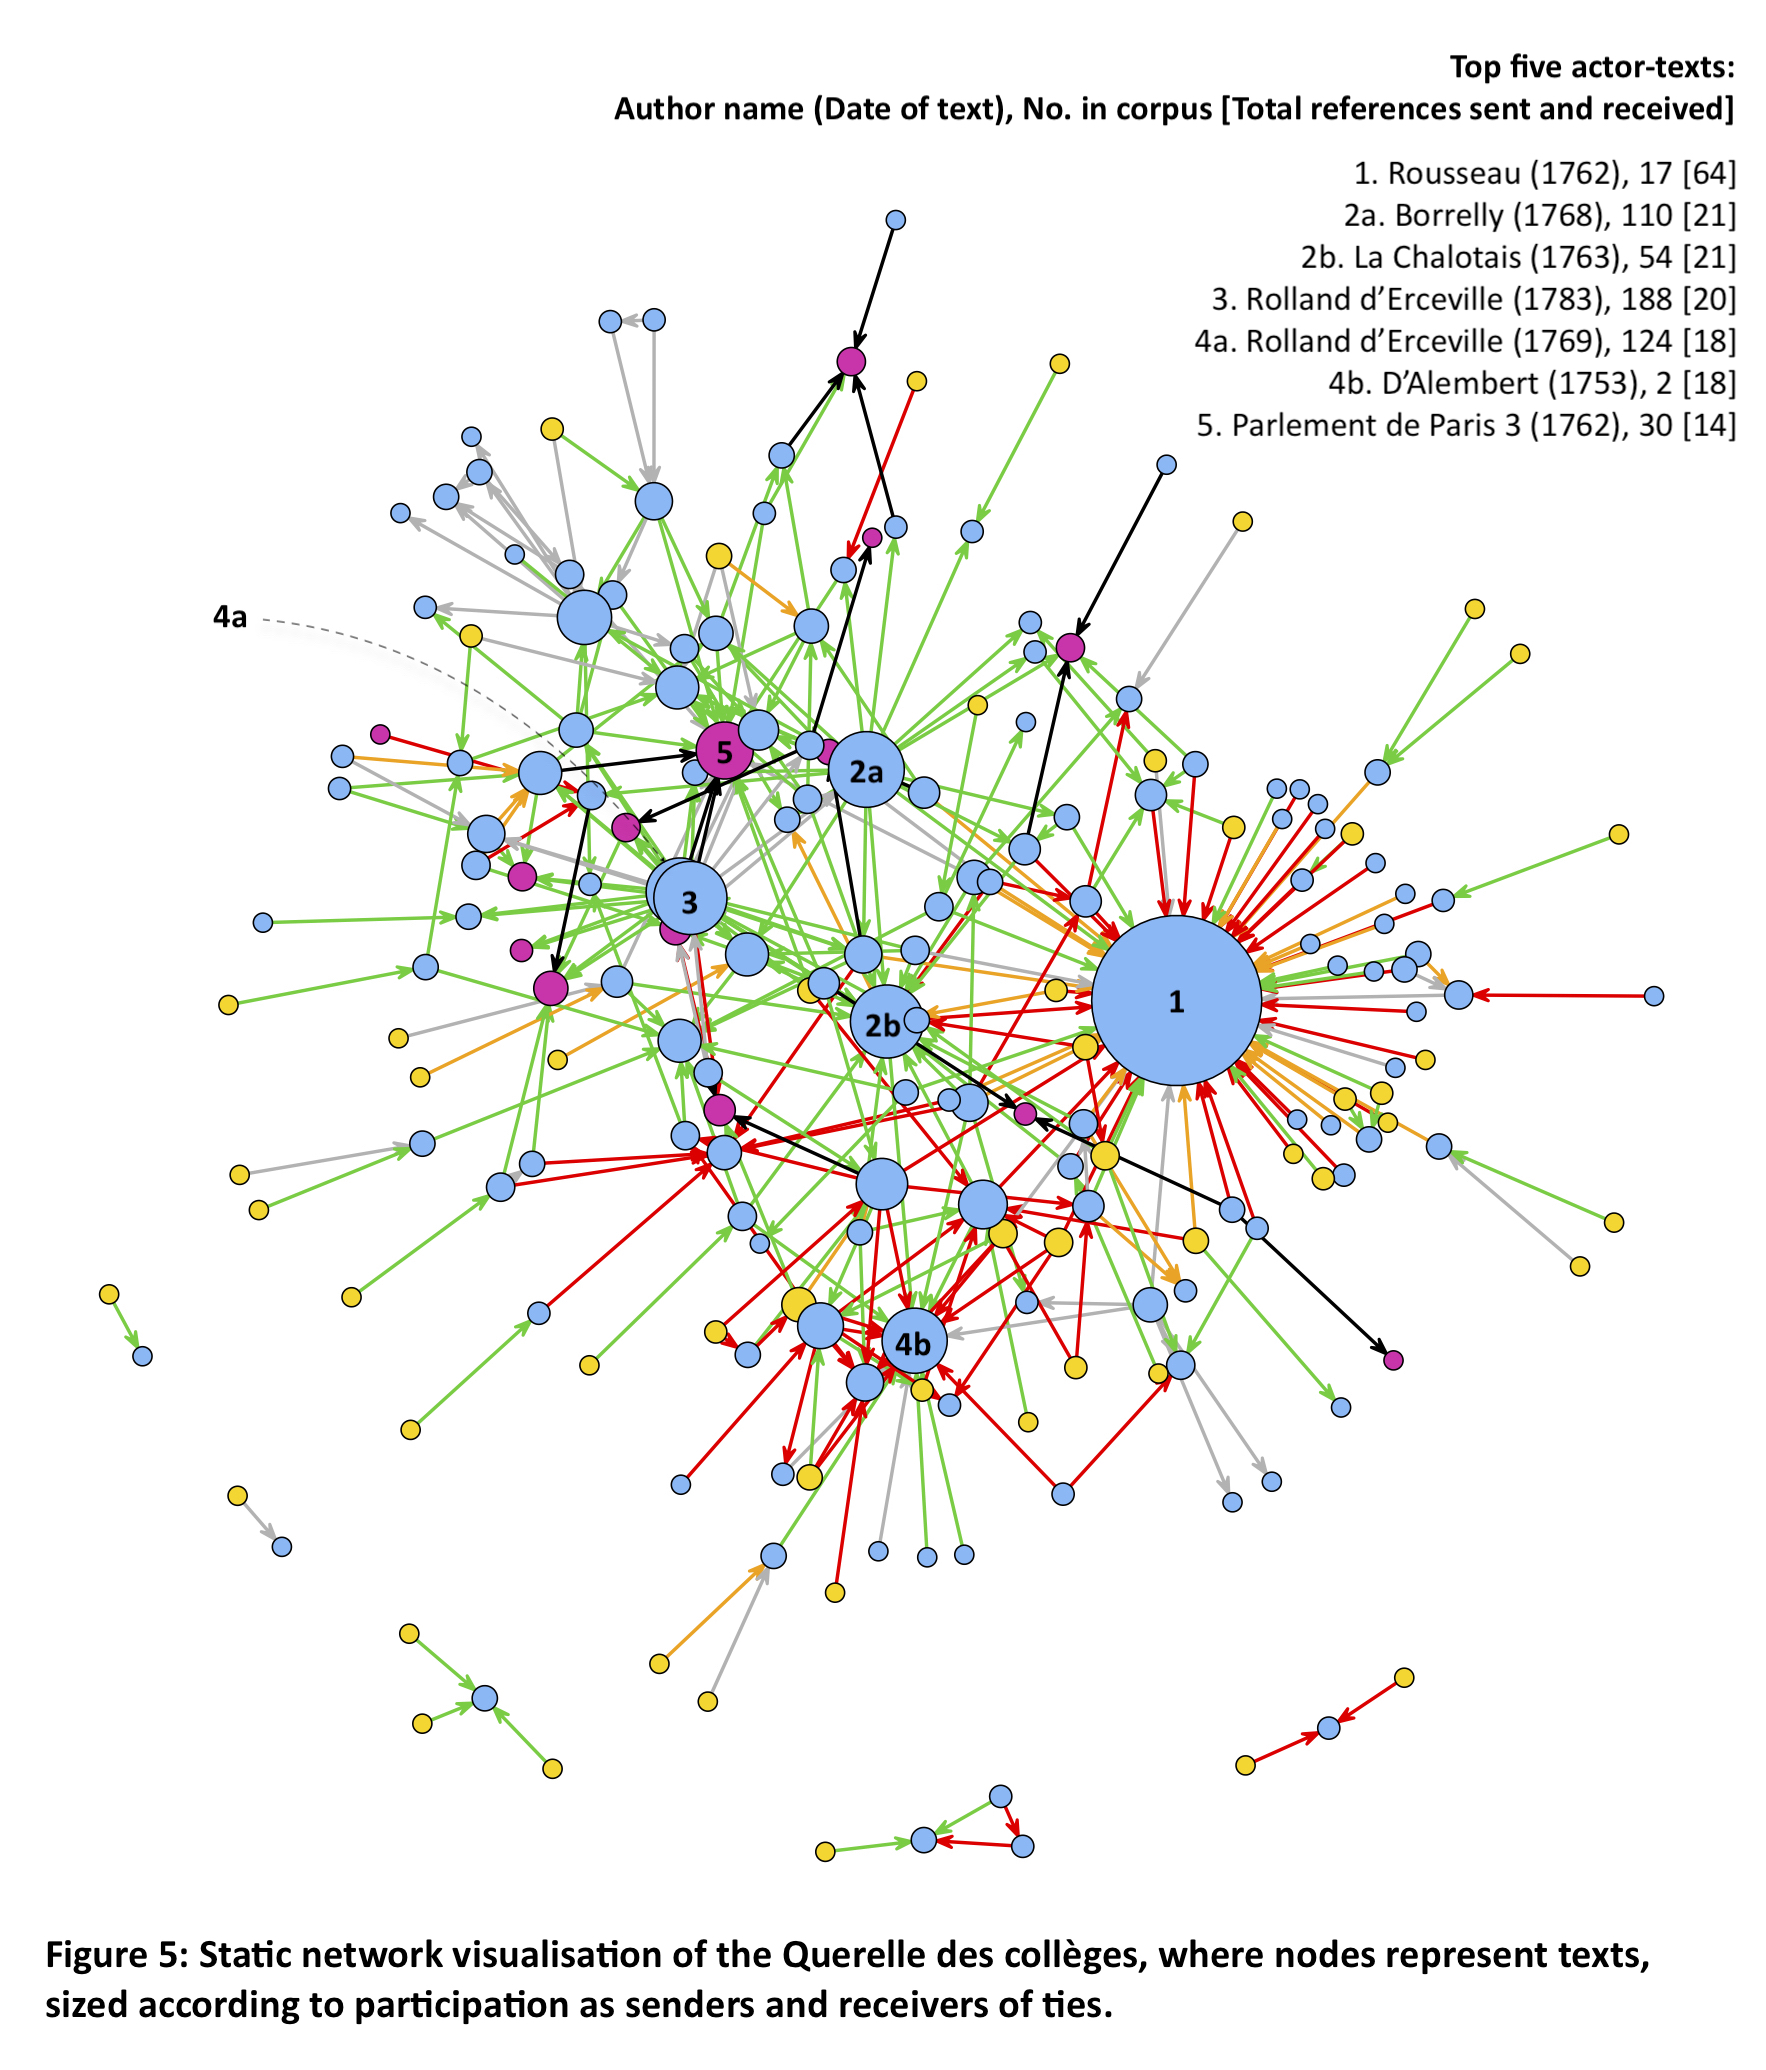
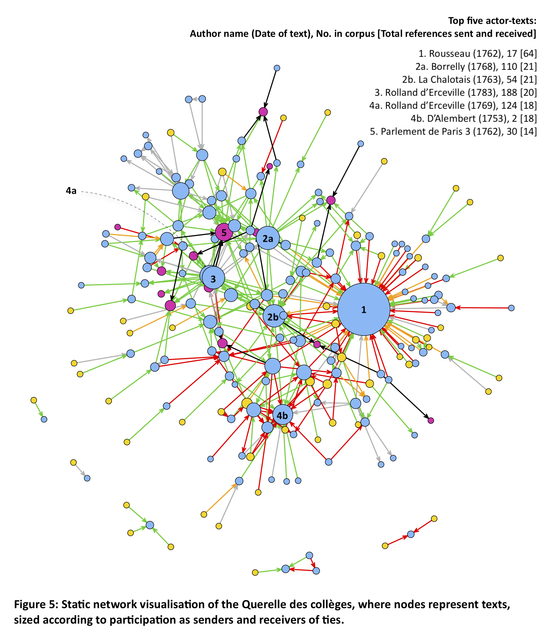
Figure 5: Static network visualisation of the Querelle des collèges, where nodes represent texts, and where node size is a function of ties sent and received.
Annotations
No one has annotated a text with this resource collection yet.