Skip to main contentResource added 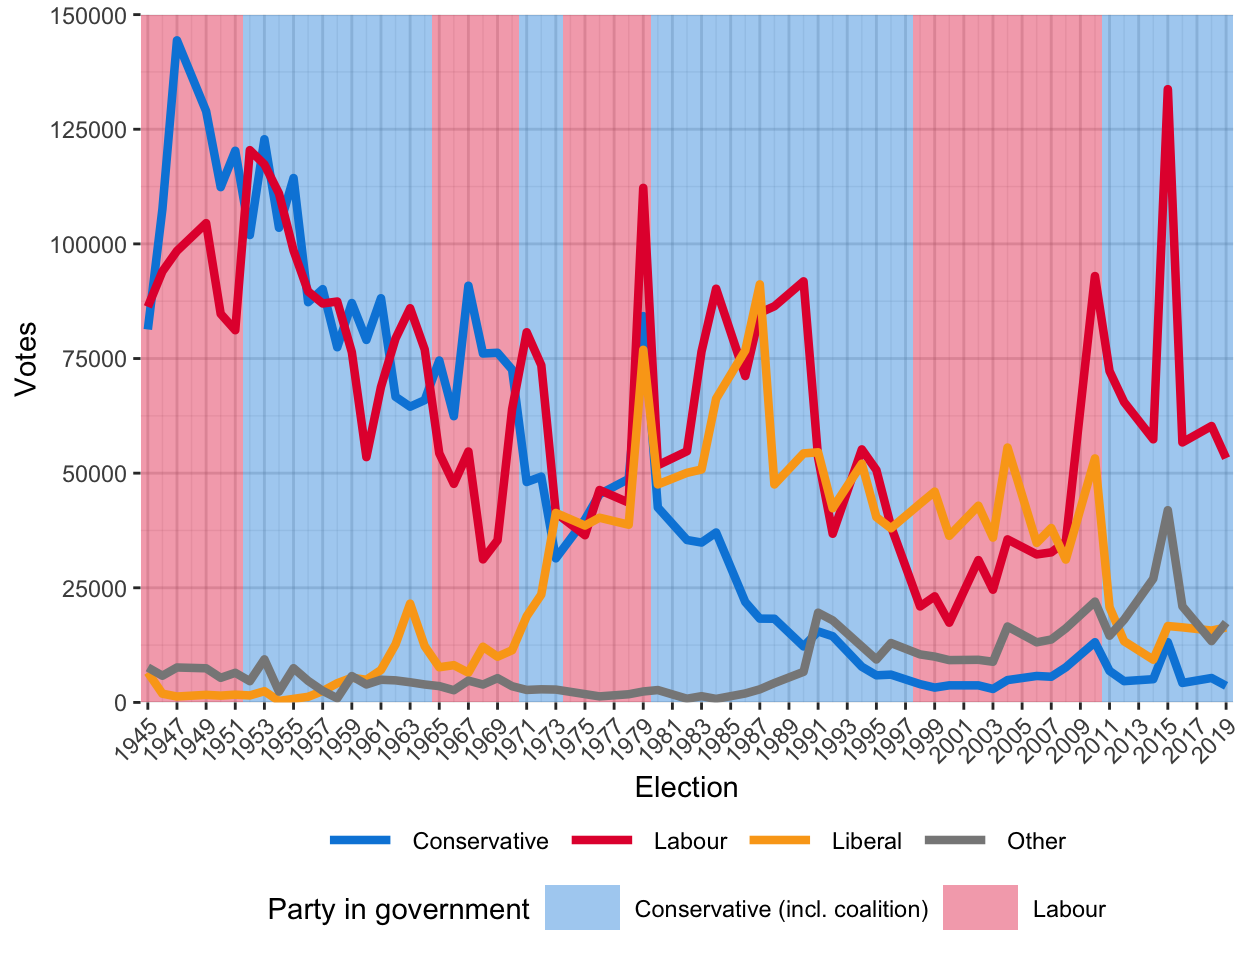


Figure 7.3
Total party vote in local elections in Liverpool, and party of government, 1945–1973.
Comments
to view and add comments.
Annotations
No one has annotated a text with this resource yet.
- typeImage
- created on
- file formatpng
- file size219 kB