Skip to main contentResource added 
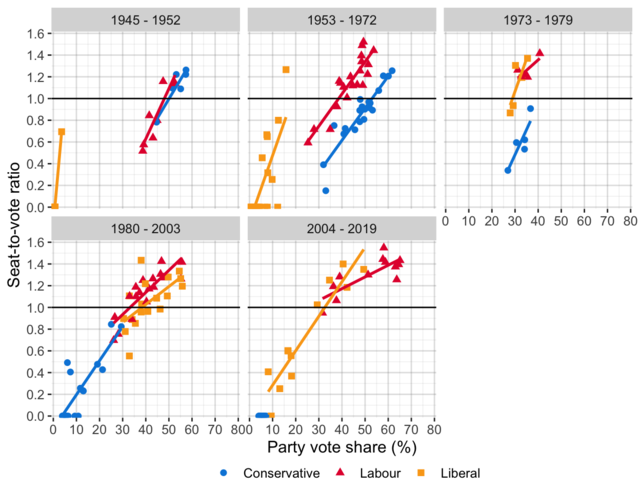

Figure 4.5
Seat-to-vote ratio compared to party vote share, 1945–2019, by ward boundary system.
Full description
Note: The data controls for multi-ward elections by considering just the first-placed candidate for each party. The 1945 figure for the Liberal Party has been excluded owing to the very high seat-to-vote ratio: the party stood in three seats, winning one (2.6 per cent of the total) on a city-wide vote share of 0.9 per cent. This gives a seat-to-vote ratio of 2.9.
Comments
to view and add comments.
Annotations
No one has annotated a text with this resource yet.
- typeImage
- created on
- file formatpng
- file size187 kB