Skip to main contentResource added 
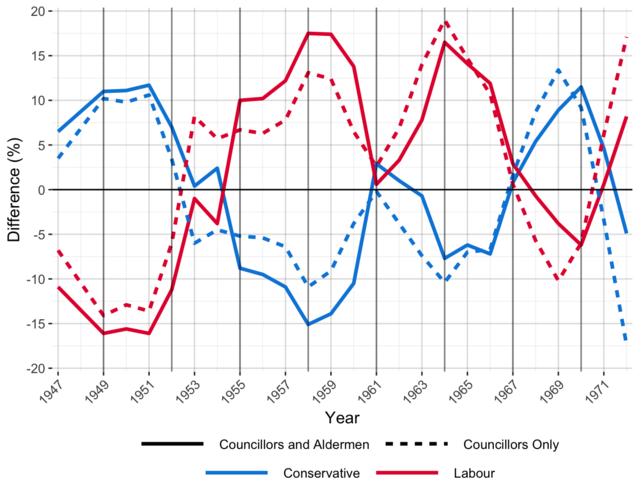

Figure 4.3
Difference between total elected councillors and averaged vote share alongside difference between total council makeup and averaged vote share, 1947–1972.
Comments
to view and add comments.
Annotations
No one has annotated a text with this resource yet.
- typeImage
- created on
- file formatpng
- file size201 kB