Skip to main contentResource added 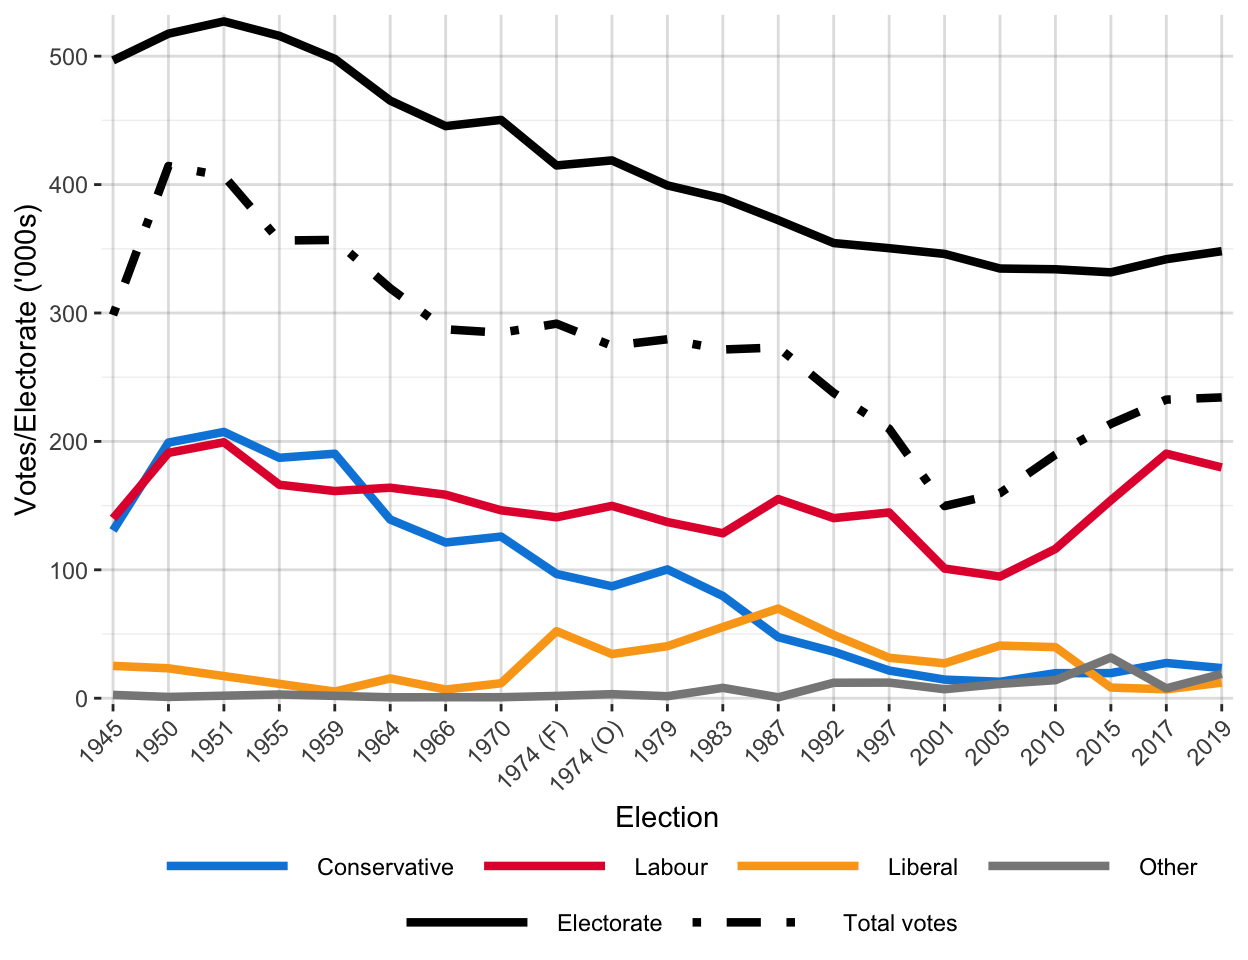
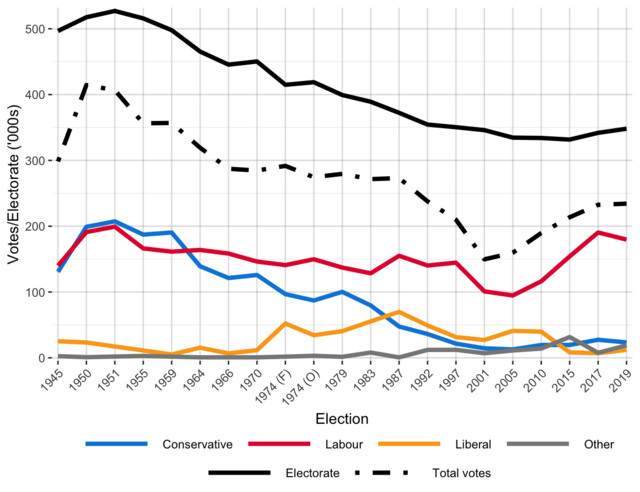

Figure 1.6
Number of votes for each party in general elections in Liverpool, 1945–2019.
Full description
Source: Kollman et al. (2020) and Watson, Uberoi, and Loft (2021).
Comments
to view and add comments.
Annotations
No one has annotated a text with this resource yet.
- typeImage
- created on
- file formatpng
- file size158 kB