Digitized, full-colour versions of the graphs included in the print book
Resource slideshow
Resources
Showing 1-4 of 4 resources4 resources. Showing results 1 through 4.
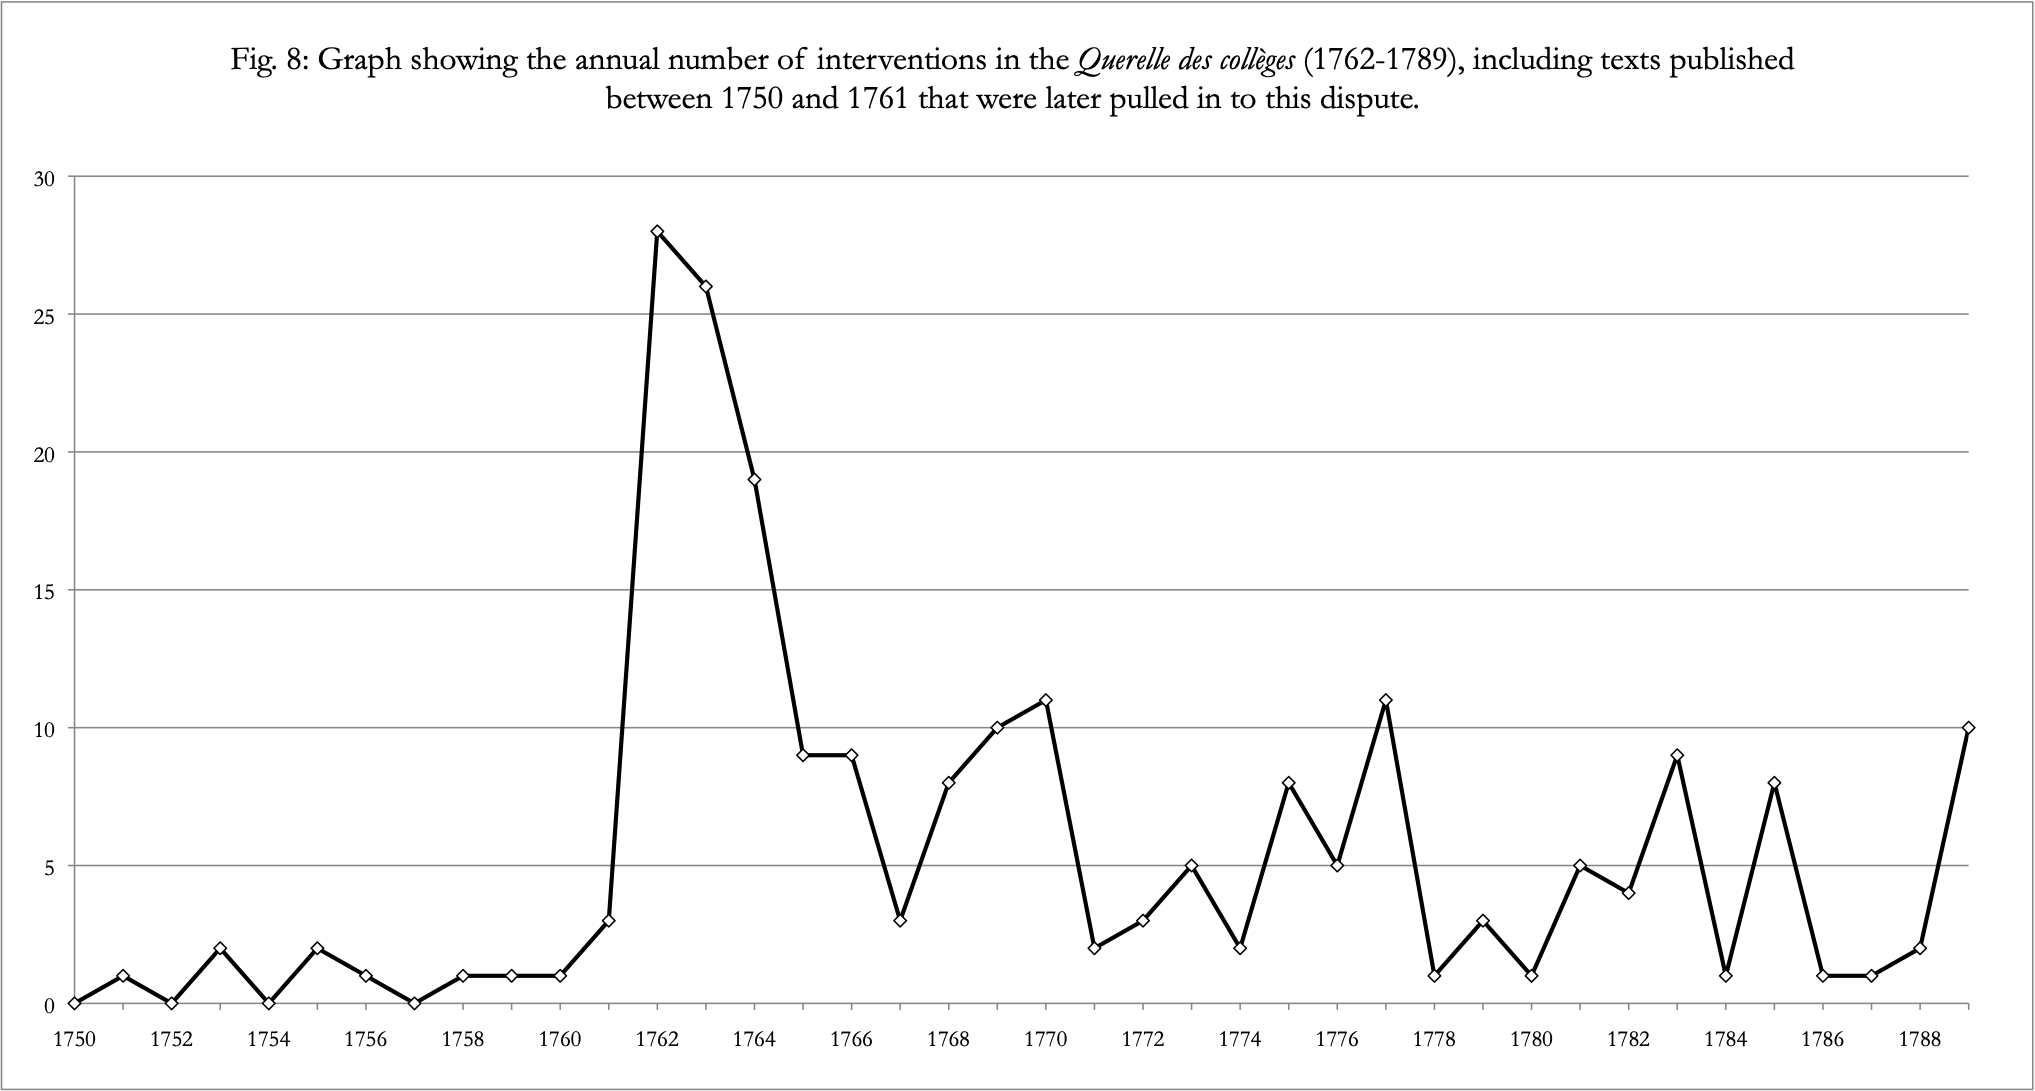
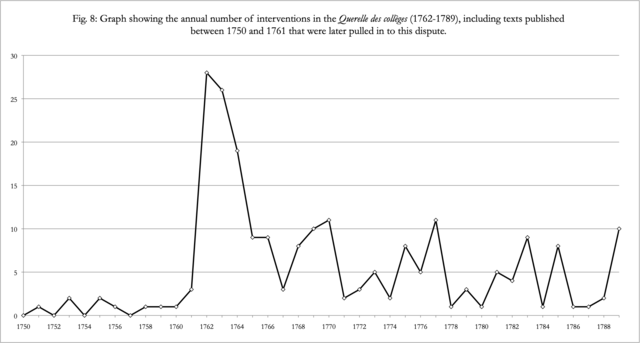
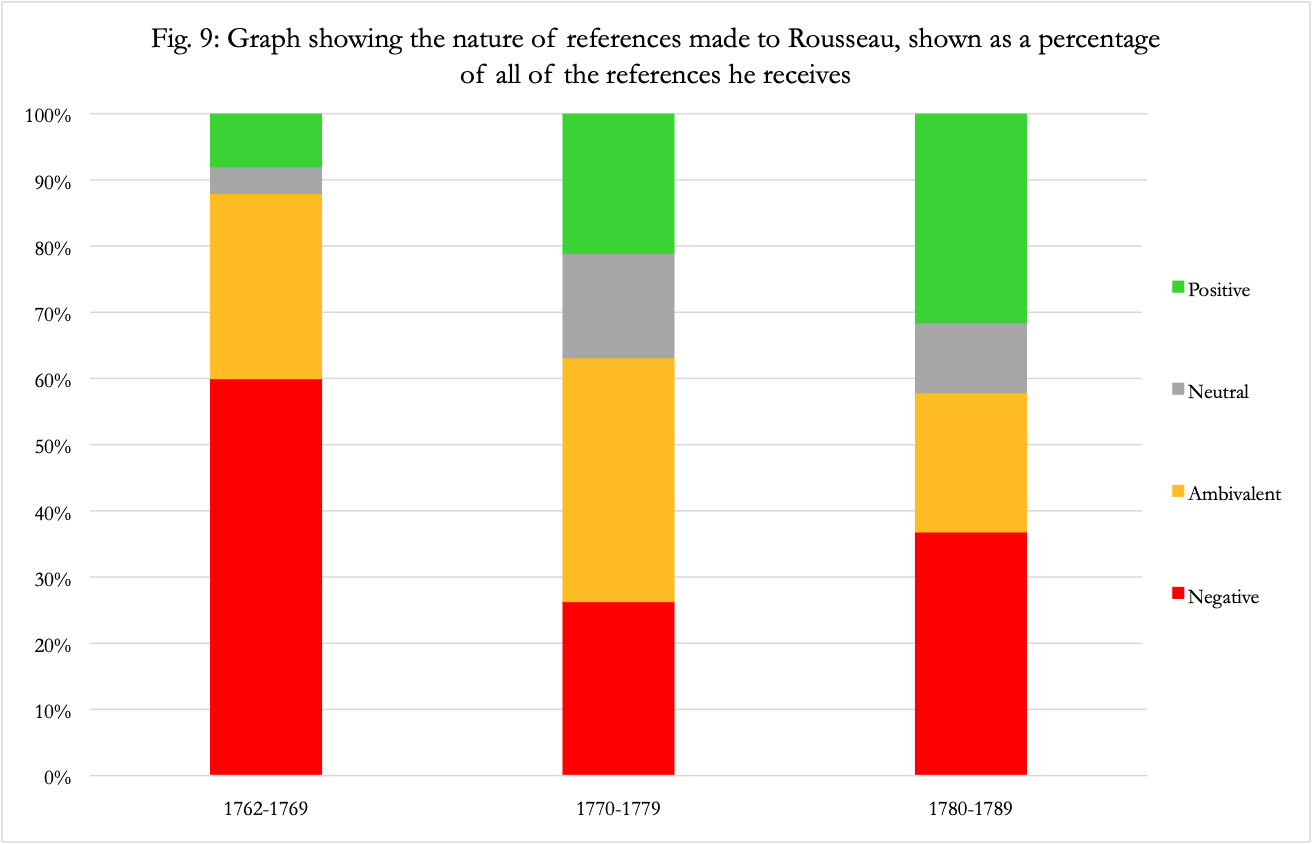
Figure 8: Graph showing the annual number of interventions in the Querelle des collèges (1762-1789), including texts published between 1750 and 1761 that were later pulled in to this dispute.
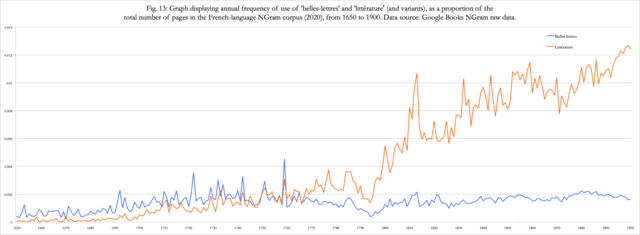
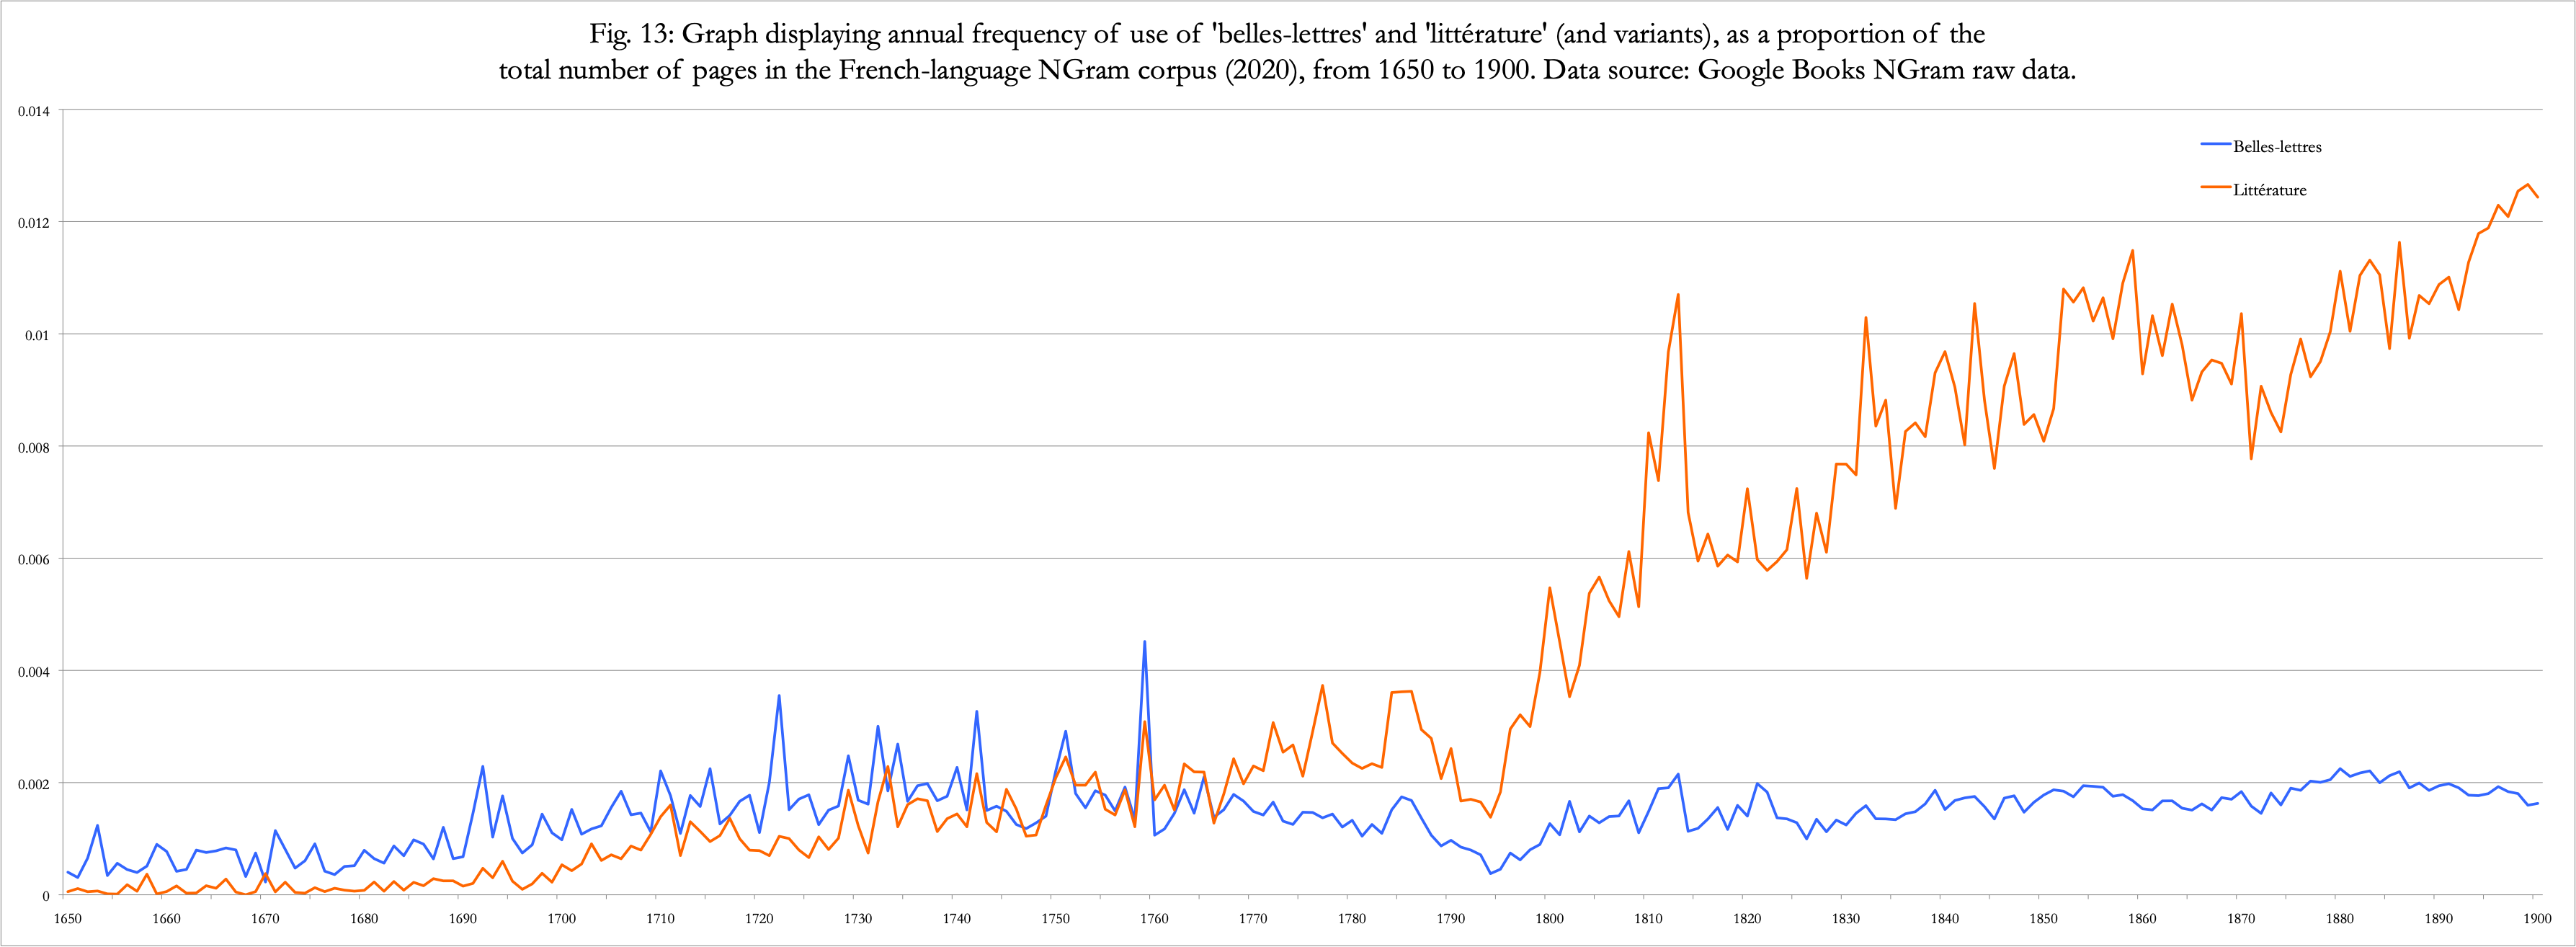
Figure 13: Graph displaying annual frequency of use of the words belles-lettres and littérature (and variants), as a proportion of the total number of pages in the French-language Ngram corpus (2020), from 1650 to 1900.
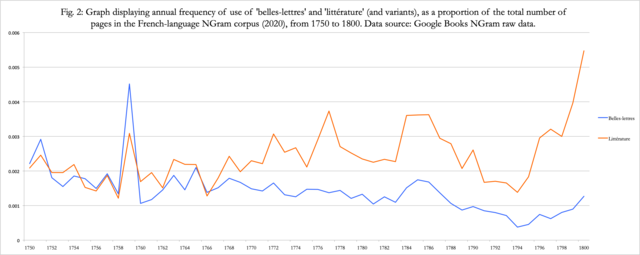
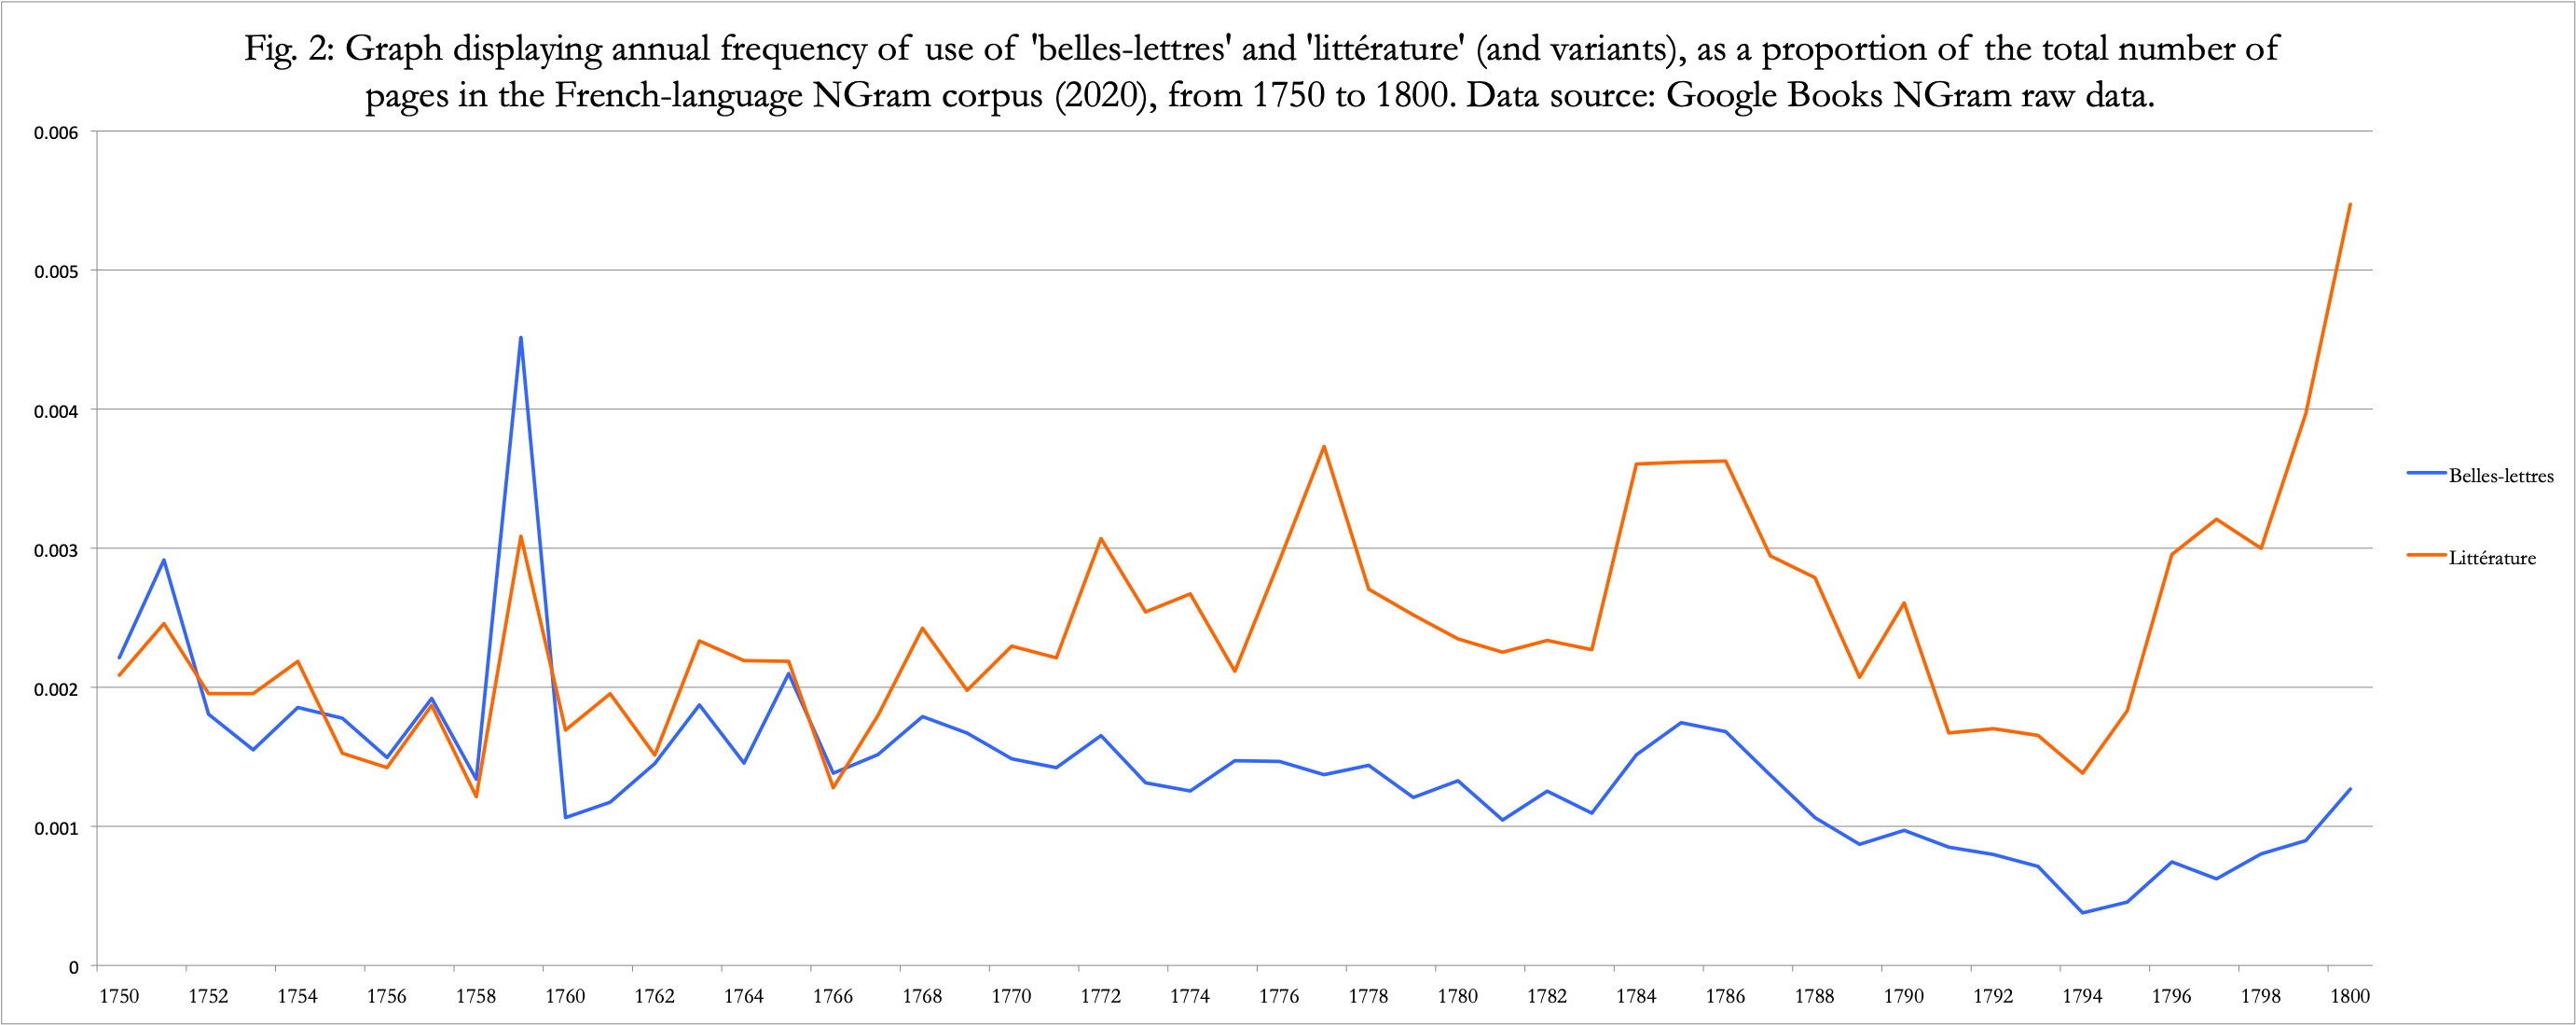
Figure 2. Annual frequency of use of the words ‘belles-lettres’ and ‘littérature’ (and variants), as a proportion of the total number of pages in the French-language NGram corpus (2020), from 1750 to 1800.