Skip to main contentResource added 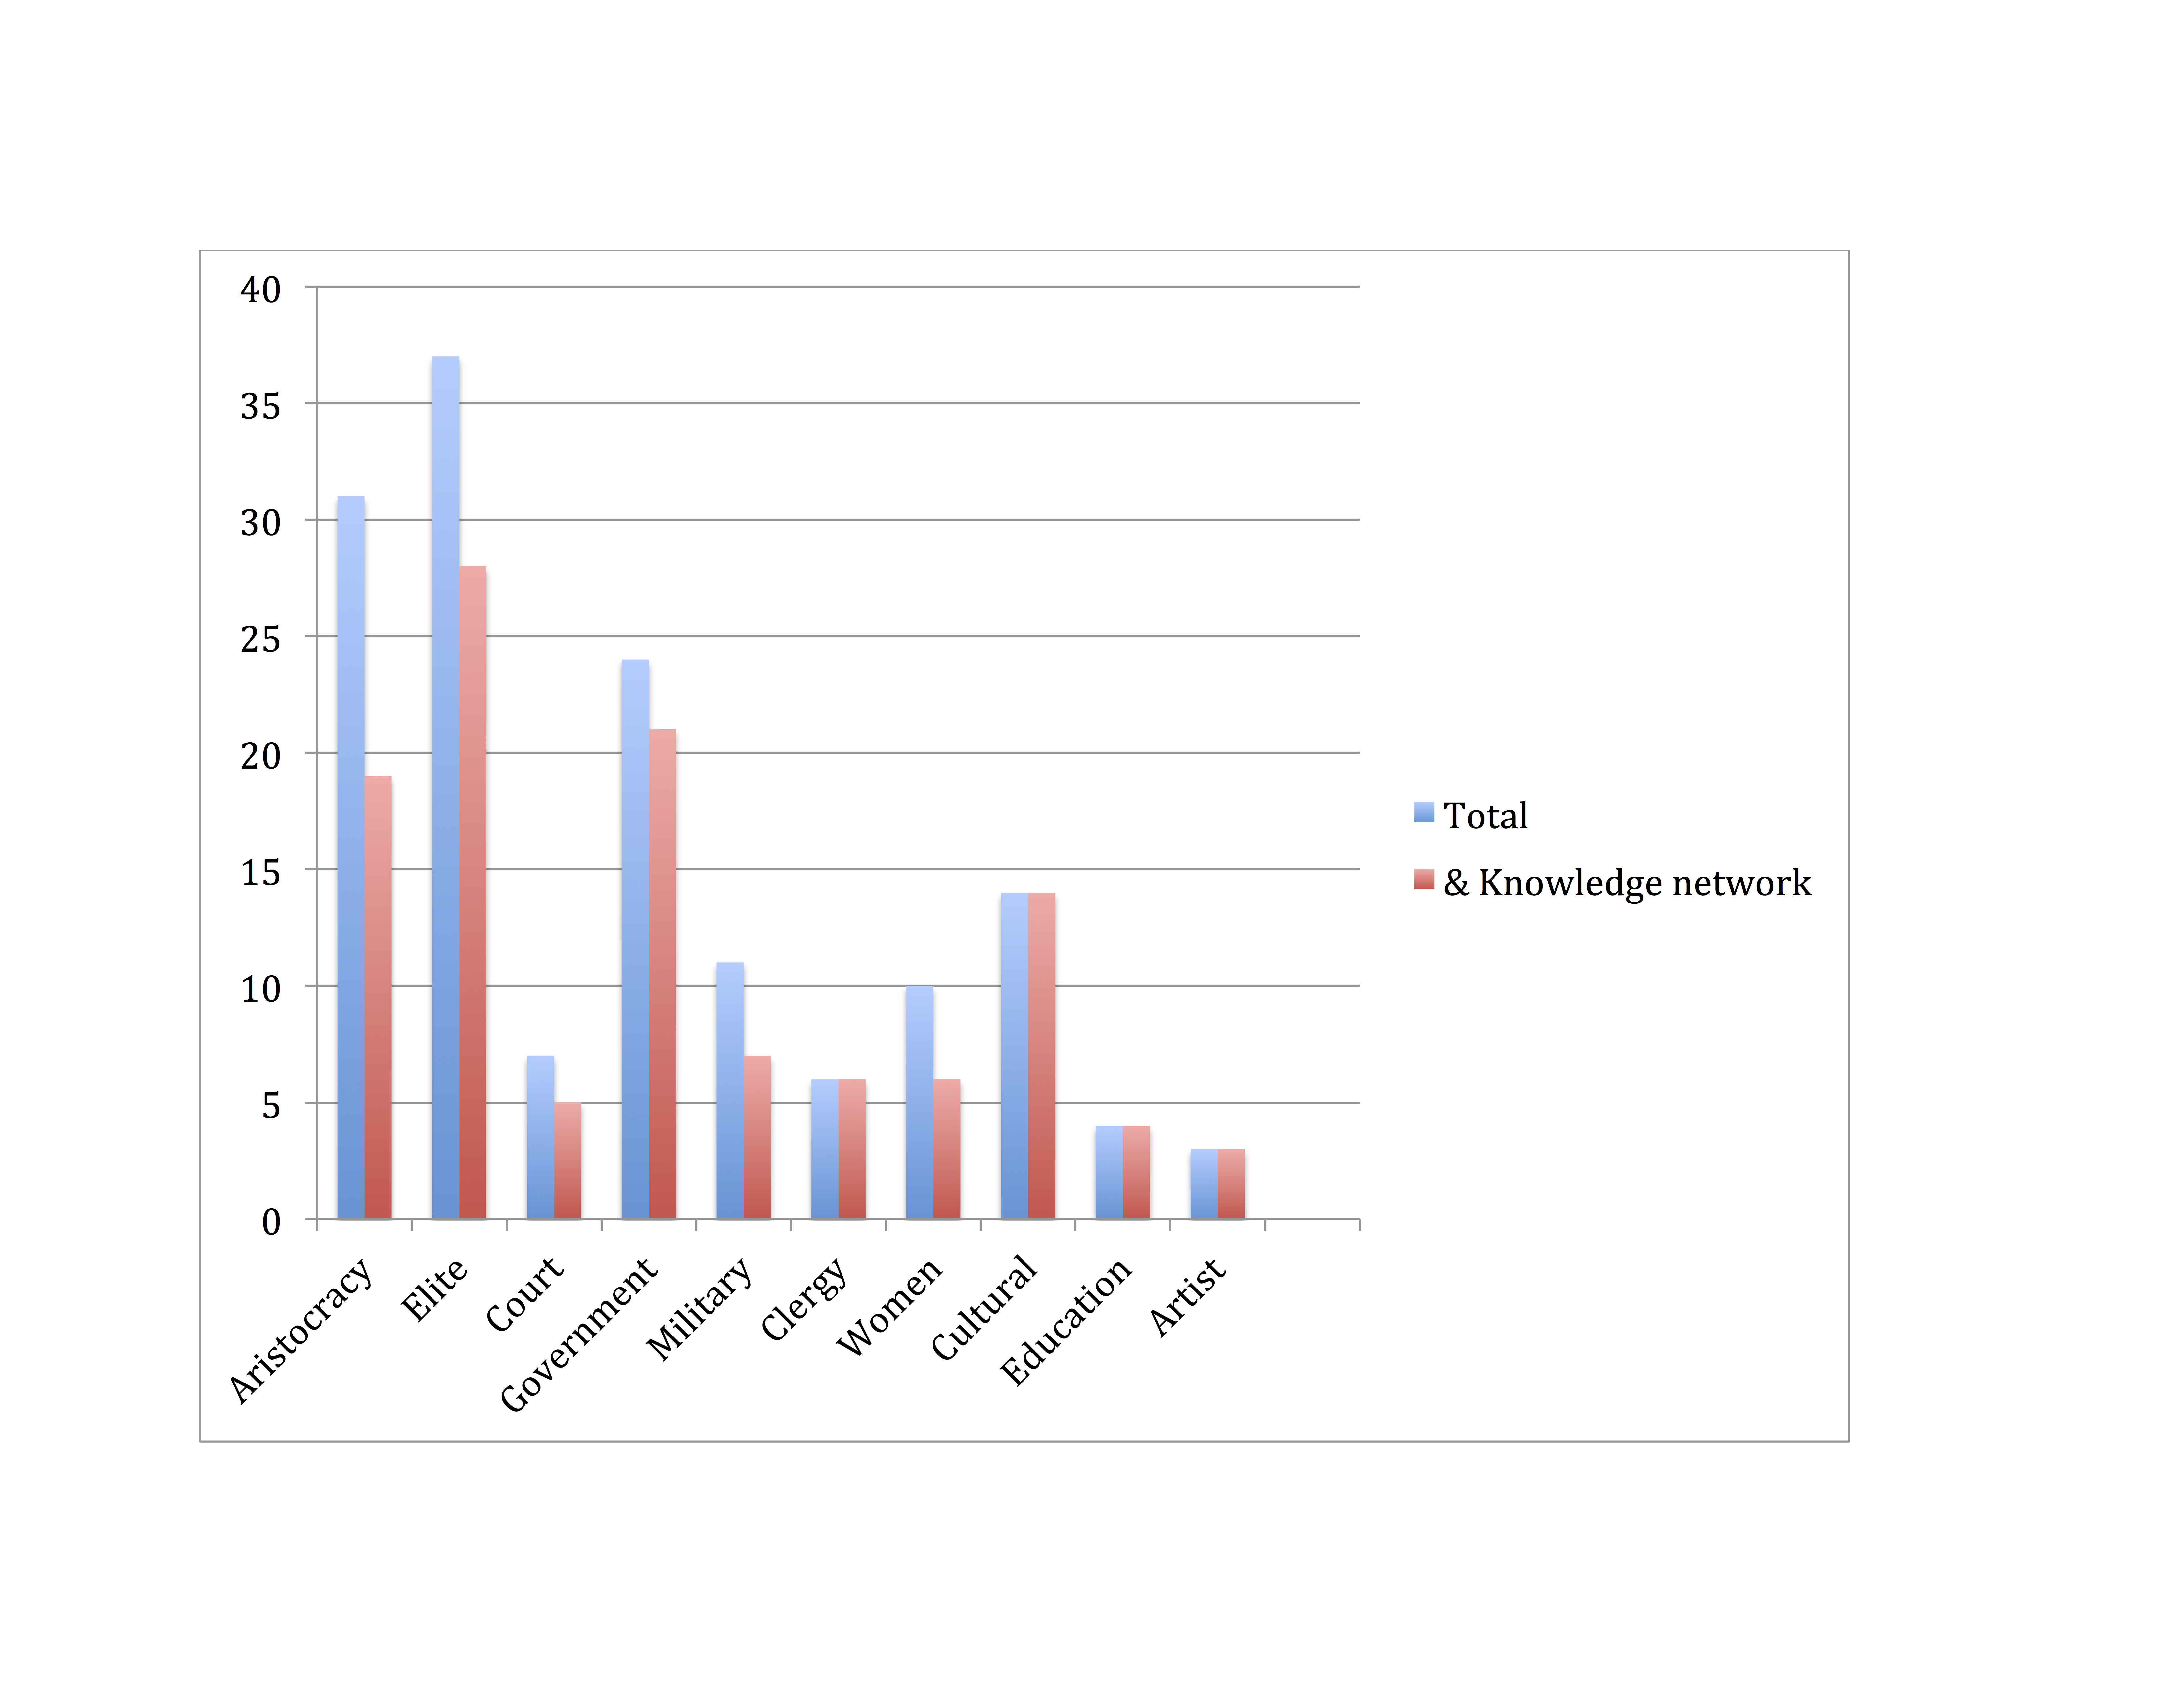
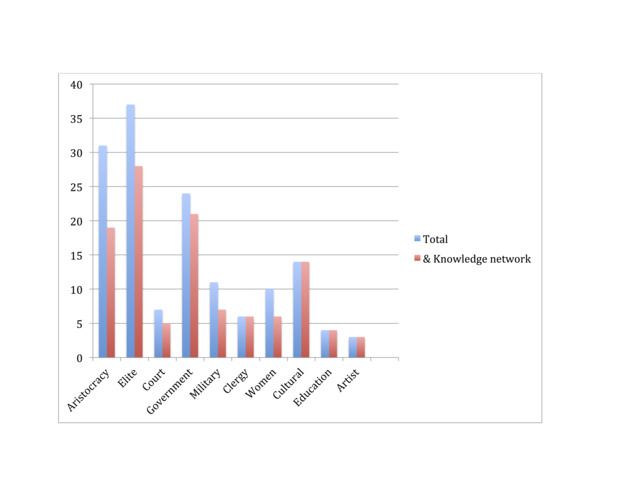

Figure 16- Proportions of knowledge networks in each social demographic
Full description
Proportions of knowledge networks in each social demographic. The first bar in each category indicates the number of people in each social or professional group, whereas the second bar designates the number of the individuals in that group who are also in a knowledge network. For example, twenty-four salon attendees were government officials, and twenty-one of those individuals were also gens de lettres.
Comments
to view and add comments.
Annotations
No one has annotated a text with this resource yet.
- typeImage
- created on
- file formatpng
- file size1 MB